Bitcoin Price Breaks Through The $65,000 Level

The price of Bitcoin (BTC) has made another positive move, rising above the moving average lines.
Bitcoin had already crashed and found support above the psychological price threshold of $60,000, now it is reaching above $65,000.
Long-term forecast for the BTC price: bullish
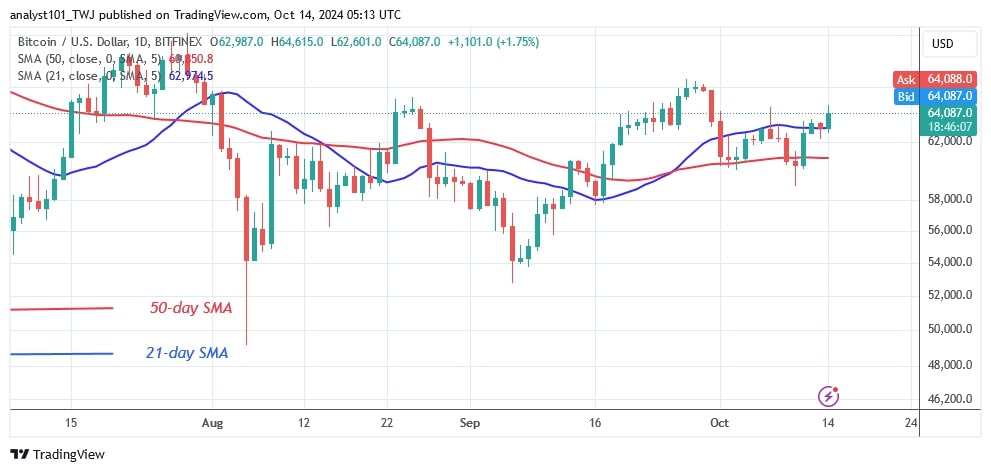
On October 12, the price of the cryptocurrency broke through the 21-day SMA resistance, but then pulled back to test it, as reported by Coinidol.com.
Today, the uptrend started above the 21-day SMA support and reached a high of $64,615. Should the bulls break above the $65,000 resistance, Bitcoin will rise to a high of $70,000.
If it falls below its recent high, it will enter a trading range again. Since August 23, buyers have tried to break above the $65,000 high but have failed.
BTC indicator reading
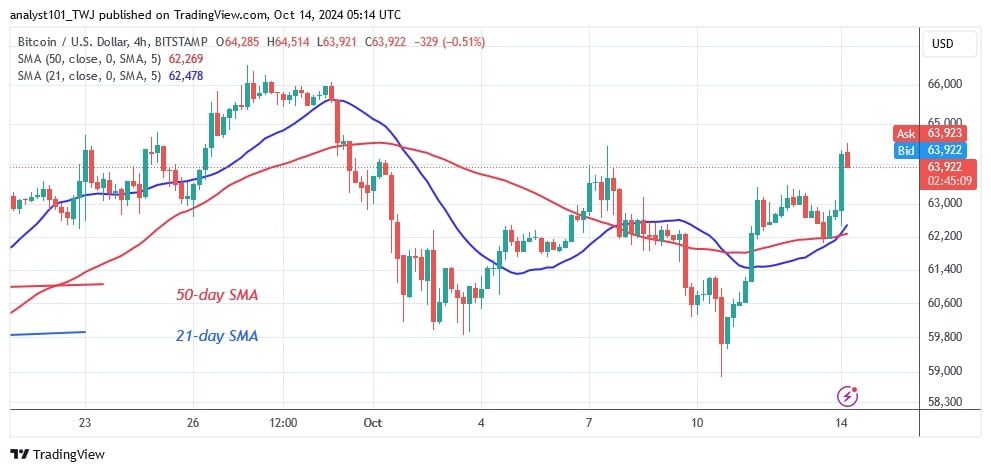
Bitcoin has recovered above the moving average lines. The price could rise above the 21-day SMA support. Bitcoin's uptrend has ended and the price is moving above the 21-day moving average line. The moving average lines have shown a bullish crossover, which means that the cryptocurrency value will rise.
Technical indicators:
Resistance Levels – $70,000 and $80,000
Support Levels – $50,000 and $40,000

What is the next direction for BTC/USD?
On the 4-hour chart, Bitcoin has risen and retested the $64,000 resistance level. Now, buyers are trying to keep the price above the $65,000 mark.

Disclaimer. This analysis and forecast are the personal opinions of the author. They are not a recommendation to buy or sell cryptocurrency and should not be viewed as an endorsement by CoinIdol.com. Readers should do their research before investing in funds.
Price
Price
News
Price
Coin expert

(0 comments)