Bitcoin Maintains Technical Bullish Signal Despite Weak Traditional Markets
Updated: Mar 07, 2020 at 12:39

Bitcoin upholds its technical strength despite overall weakness in traditional asset markets such as stock and bond yields on March 6. Asian and European cryptocurrency markets plunged on Tuesday, and the New York stocks also dropped
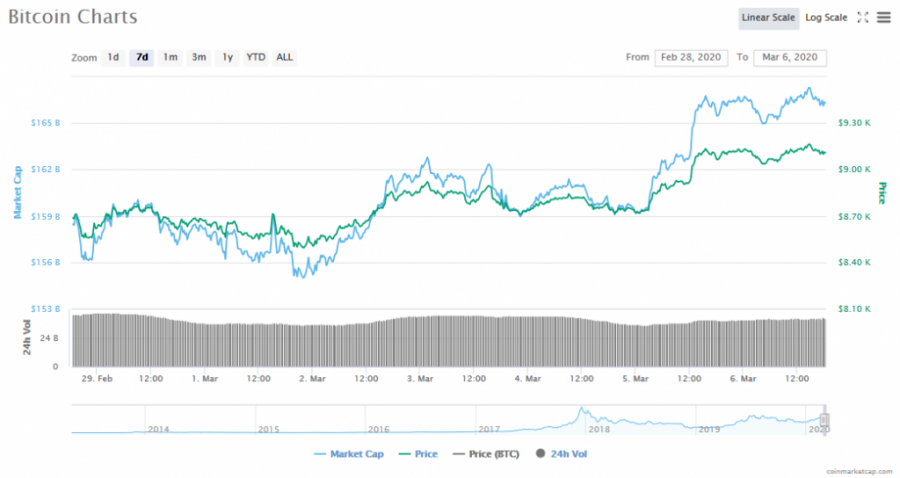
Bitcoin pointed to $9108.01, up 0.15% from 24 hours ago at 9:21 am in New York time. BTC/USD has been stable above the $9000 level since recovering the $9000 line the day before.

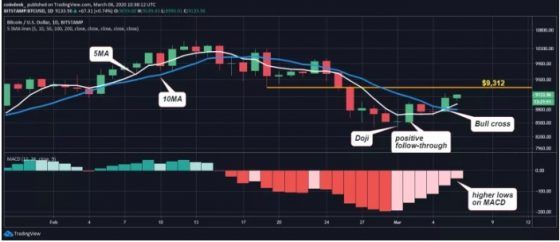
The moving average (MA) convergence and divergence index (MACD) on the daily chart shows that the situation continues to favor bullish players as the lows continue to rise. Moreover, the five-day MA broke through the 10-day MA, suggesting a strong market turnaround.
BTC/USD may test the $9312 resistance (lower on Feb. 4) this weekend, and that price would be exposed to $9,550 (a breakout goal of the reverse head and shoulders pattern).
But if Bitcoin is pushed below the $9000 (backline head and shoulder pattern neckline), which has turned from support to a support line, some buyers may leave the market and retreat up to 200 days MA. The 200-day MA is currently priced at $8704.
If BTC closed below its lows ($8410) on the March 1, it will point out that the bullish reversal dodge pattern identified on the March 2 will be nullified, suggesting the continued price retreat, which began at a high of $1,500 in February.
May Rebound Even After a Slight Decline
Although bitcoin has not yet gained the momentum needed for a further rise after the breakthrough of $9200, the support is still around $9000.
There is a bullish trendline on the Bitcoin time chart, with support around $9100, but it may rebound from $9102 to $8800, although it is likely that BTC will experience some downward revisions.
It is expected that Bitcoin could generate strong buying attention if it retreats below the $9000 and $8950 support levels. The closest major obstacle to BTC is around $9,200 and beyond that level, the next target will be $9,500.

At press time, BTC/USD is pointing at a high of $9,167 and a low of $9,032.08, according to the data from CoinMarketCap.
Price
News
Coin expert
News
Price

(0 comments)