Bitcoin Loses Critical Support And Falls Back To $58,555

Cryptocurrency analysts of Coinidol.com report, Bitcoin (BTC) price is moving in a range after the price drop on June 24.
Bitcoin price long-term forecast: bearish
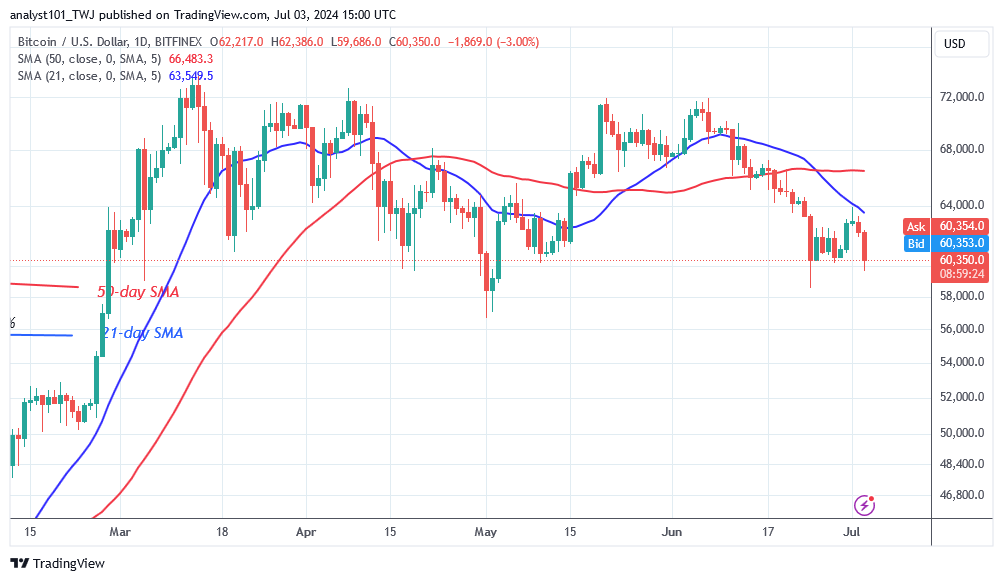
The largest cryptocurrency plummeted to a low of $58,555 and recovered again. On June 25, there was a consolidation above the psychological price level of $60,000, signaling the end of the decline. The cryptocurrency rallied above the current support and reached a high of $63,911. The upside momentum was halted by the 21-day SMA or the $64,000 resistance level. After rejecting the moving average lines, the largest cryptocurrency dropped to its current support level of $60,000. Should the bears break the current support of $60,000, Bitcoin would fall to a low of $58,555. The bearish momentum will continue to the low of $56,711. However, if the current support of $60,000 holds, the largest cryptocurrency will continue to move in a range below the moving averages.
Bitcoin indicator reading
The 21-day SMA serves as a resistance line for the price bars. On July 1, a long candlestick wick broke through the resistance line of the 21-day SMA. The long candlestick wick indicates significant selling pressure at the 21-day SMA level. On the daily chart, the 21-day SMA has crossed below the 50-day SMA, which is a bearish signal.

Technical indicators:
Key resistance levels – $70,000 and $80,000
Key support levels – $50,000 and $40,000
What is the next direction for BTC/USD?
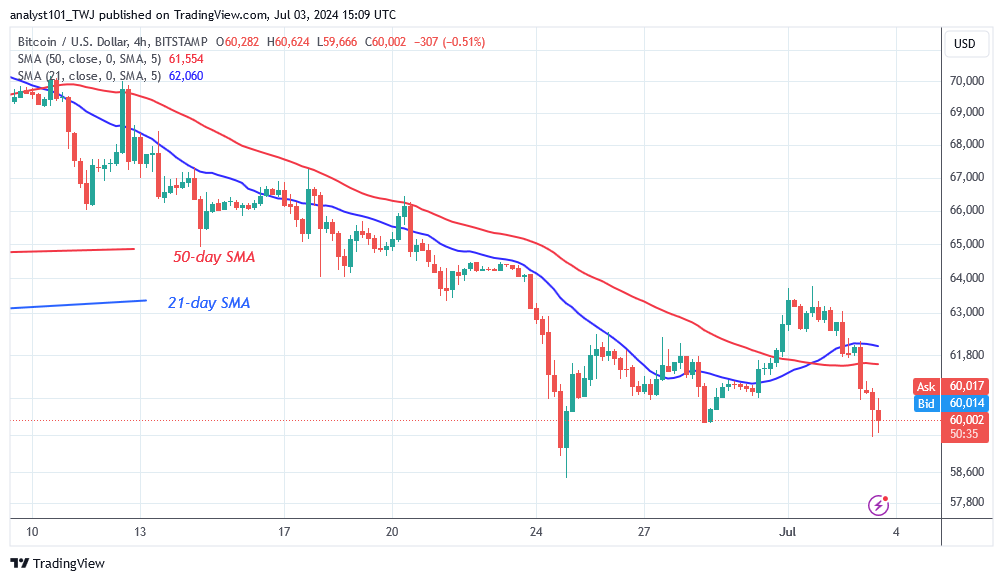
On the 4-hour chart, Bitcoin is trading in a range above the psychological price of $60,000. Bitcoin is trading between $58,600 and $64,000. The cryptocurrency crashed and tested the current support level of $60,000 three times before consolidating above it. Bitcoin will perform once the existing support and resistance levels are broken.

Disclaimer. This analysis and forecast are the personal opinions of the author. They are not a recommendation to buy or sell cryptocurrency and should not be viewed as an endorsement by CoinIdol.com. Readers should do their research before investing in funds.
Price
Price
News
Price
Price

(0 comments)