Bitcoin Hovers in the Mid $9,000 Region, Faces Rejection at $9,800 Resistance

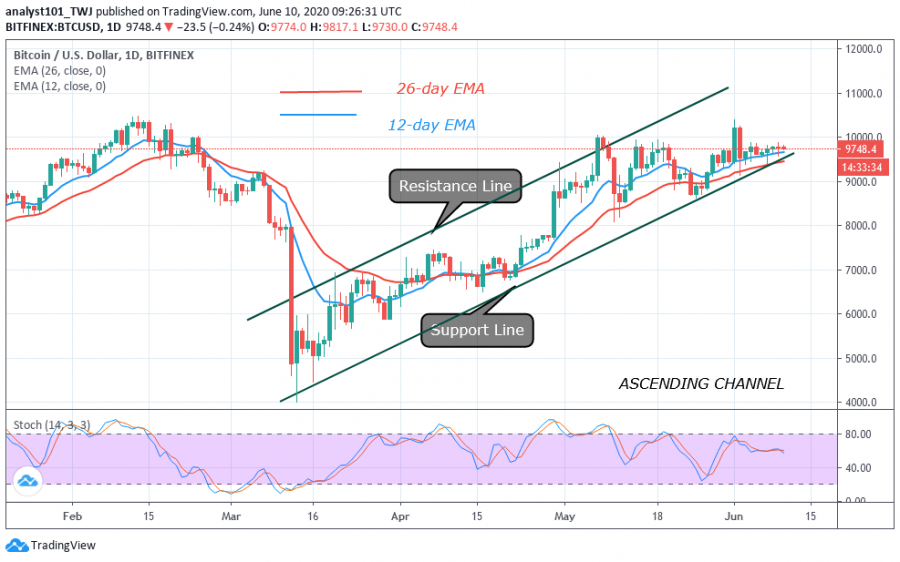
From the daily chart, Bitcoin bulls have failed to break the $10,000 overhead resistance since June 1. BTC has been restricted below $9,800 resistance.
Buyers have retested the $9,800 resistance on four occasions and unable to push price above it. The price movement has been immaterial and marred by low volatility. Before this time, in May, price fluctuated in the upside range between $9,300 and $9,800 to retest the $10,000 overhead resistance.
Today, price movement has been insignificant as bulls are repelled at $9,800 resistance. The momentum is insufficient to retest the overhead resistance. Nonetheless, price has been repelled several times at $9,800 resistance, and there is a tendency of a possible downward movement of price. Bitcoin is likely to decline if the $9,600 or $9,500 support cracks. We shall experience a downward move from $9,600 to $9,400. If the selling pressure persists, BTC will fall to $8,800 low.
Bitcoin Indicator Reading
Presently, BTC is above 50% range of the daily stochastic. The stochastic bands are horizontally flat, reflecting the current price action. The market is characterized by small indecisive candlesticks describing the indecision between buyers and sellers about the market direction.

Key Resistance Zones: $10,000, $11,000, $12,000
Key Support Zones: $7, 000, $6, 000, $5,000
What Is the Next Direction for BTC/USD?
Since June 1, BTC has been hovering between the mid $9,000 region. This is because of inconsistency in the upside range and lack of function due to low volatility. All the positive moves have been repelled at the $9,800 resistance. The upside range will continue as long as the $9,400 support holds.
Disclaimer. This analysis and forecast are the personal opinions of the author are not a recommendation to buy or sell cryptocurrency and should not be viewed as an endorsement by CoinIdol. Readers should do their own research before investing funds.
Price
Price
Price
Price
Price

(0 comments)