Bitcoin Hits A Low Of $50,000 As Investors Buy The Dips
Updated: Aug 05, 2024 at 12:58

The price of Bitcoin (BTC) has dropped significantly as the largest cryptocurrency lingers above the psychological price level of $50,000.
Bitcoin price long-term prediction: bearish
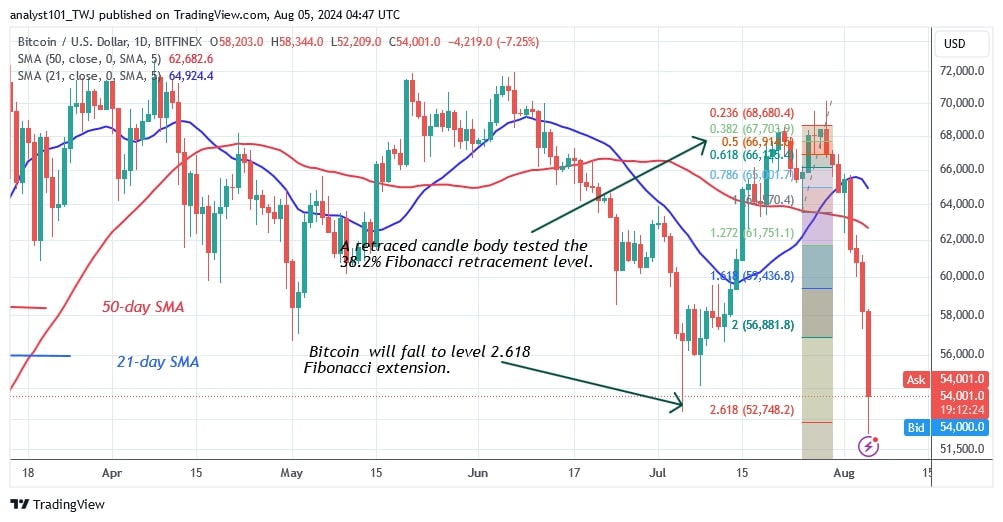
The price of the cryptocurrency has been fluctuating below the $70,000 resistance zone after being rejected at the high of $68,479 on July 21.
On July 29, the upward momentum hit resistance at $70,162, leading to the current downtrend, as reported previously by Coinidol.com. The bulls were overwhelmed as the bears broke below the moving average lines. The downtrend also broke through support at $60,000 and reached a low of $52,209. The price indicator had previously predicted a likely decline in the Bitcoin price.
On July 25, the BTC price corrected upwards and tested the 38.2% Fibonacci retracement line with a retracing candlestick body. The retracement indicates a current decline in the coin. It suggests that Bitcoin will fall to the 2.618 Fibonacci extension or $52,748.
The market has reached an oversold level and a further decline is unlikely. Bitcoin will rise if the $50,000 support remains.
Technical indicators:
Key Resistance Levels – $70,000 and $80,000
Key Levels – $50,000 and $40,000
Bitcoin indicator reading
The moving average lines tilt south when the price bars fall below them. On the 4-hour chart, the moving average lines have formed a bearish crossover, which is a negative signal for August 1. Bitcoin has entered oversold territory as it approaches the $50,000 support.

What is the next direction for BTC/USD?
Bitcoin has crashed and reached the $50,000 psychological level. It has dropped to a 4-hour low of $49,647, but the bulls have taken advantage of the dips. The largest cryptocurrency is correcting upwards above the $50,000 mark. If the current support holds, Bitcoin will have to move in a range above $50,000 and below the moving average lines.
Disclaimer. This analysis and forecast are the personal opinions of the author. They are not a recommendation to buy or sell cryptocurrency and should not be viewed as an endorsement by CoinIdol.com. Readers should do their research before investing in funds.
Price
News
Price
News

(0 comments)