Bitcoin Continues Its March And Approaches The $58,000 Level
Updated: Feb 28, 2024 at 11:19

The price of Bitcoin (BTC) rose above the support level of $51,000 and continued its positive trend. Latest price analysis by Coinidol.com.
Long-term forecast for the Bitcoin price: bullish
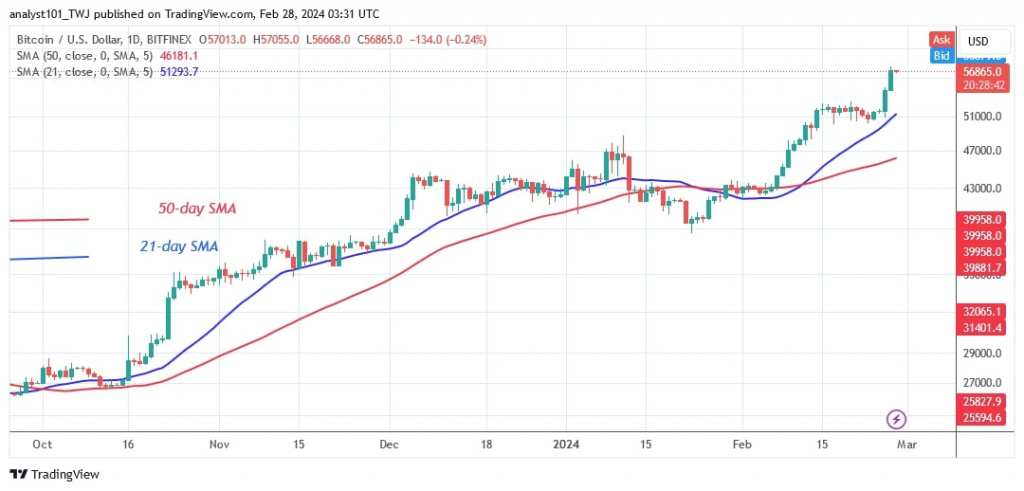
Prior to the recent price rise, the largest cryptocurrency had been trading between $50,600 and $53,000 since February 15, 2024. Doji candlesticks have dominated the market movement as Bitcoin consolidates ahead of a likely trend. On February 26, the bulls broke through the $53,000 resistance and rose to a high of $57,537 before falling back. The current BTC price is at $56,975 as this article is being written. Bitcoin is currently trading above the $56,000 support but below the $60,000 high.
If Bitcoin recovers above the current support, a rise to the psychological level of $60,000 or higher is predicted.
However, should the bears push the Bitcoin price below the $50,000 support level or the 21-day SMA, the upside scenario could be wiped out. In the meantime, Bitcoin is getting closer and closer to its goal of breaking through the $58,000 mark.
Bitcoin indicator display
Doji candlesticks have returned while price bars are stabilizing above the 21-day moving average. Bitcoin will continue to rise when the price bars move above the 21-day SMA. Bitcoin will fall as soon as the 21-day SMA support is broken. The accumulation of doji candlesticks reflects the uncertainty of traders over the past week.
Technical indicators:
Key resistance levels – $55,000 and $60,000
Key support levels – $45,000 and $40,000

What is the next direction for BTC/USD?
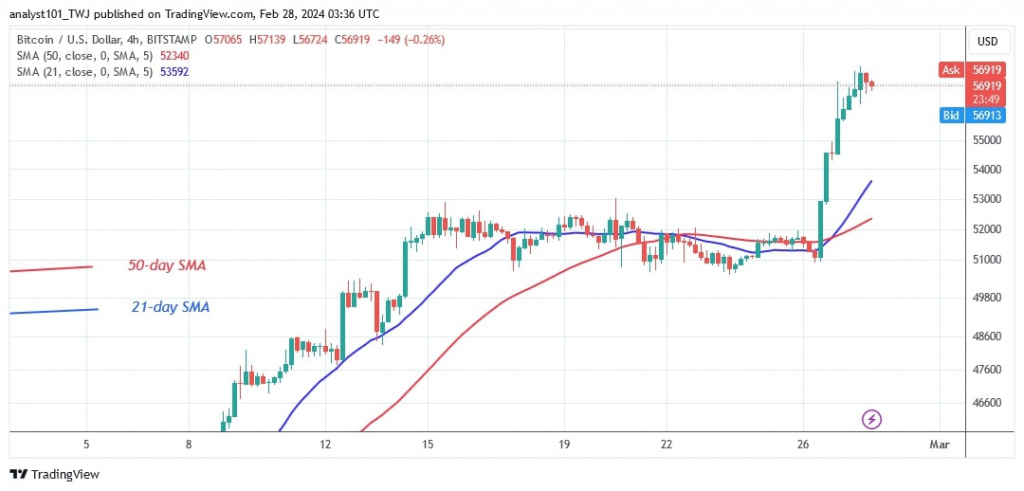
Bitcoin is likely to continue its upward march. On the 4-hour chart, BTC price has been in a sideways pattern since the uptrend was halted above the $53,000 high. Today, the bulls have gained the upper hand. The buyers still have one more hurdle to overcome before reaching the psychological price of $60,000.

Disclaimer. This analysis and forecast are the personal opinions of the author and are not a recommendation to buy or sell cryptocurrency and should not be viewed as an endorsement by CoinIdol.com. Readers should do their research before investing in funds.
Price
Politics
Price
Price
Price

(0 comments)