Bitcoin Cash is in a Tight Consolidation, May Encounter a Price Rebound or Breakout

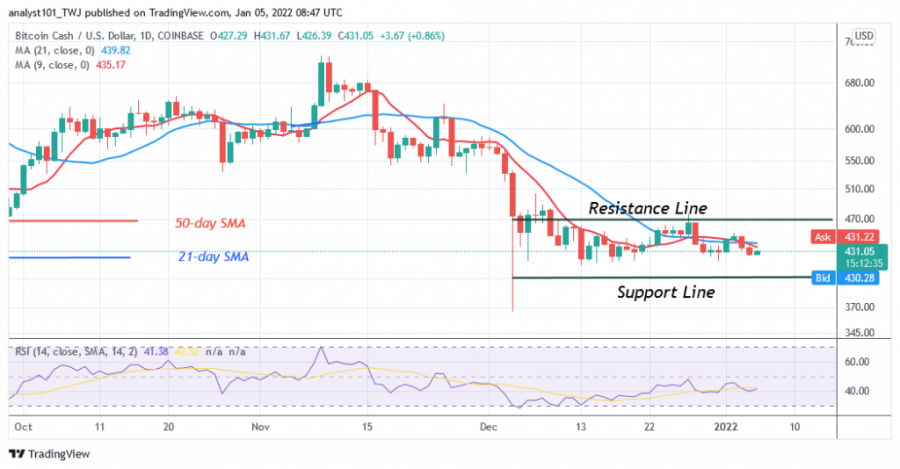
The price of Bitcoin Cash (BCH) is in a sideways trend. Since the price collapse on December 4, the altcoin's downtrend has eased but resumed consolidation above current support.
Today, BCH continues to fluctuate above the current support. The consolidation has been going on for a month now, and the price action is characterized by indecisive candlesticks with small bodies called doji and spinning tops. These candlesticks indicate that buyers and sellers are indecisive about the direction of the market. It is unlikely that the cryptocurrency will develop a trend as long as doji candlesticks dominate price action. In the meantime, BCH/USD is hovering between $400 and $470.
Bitcoin Cash indicator reading
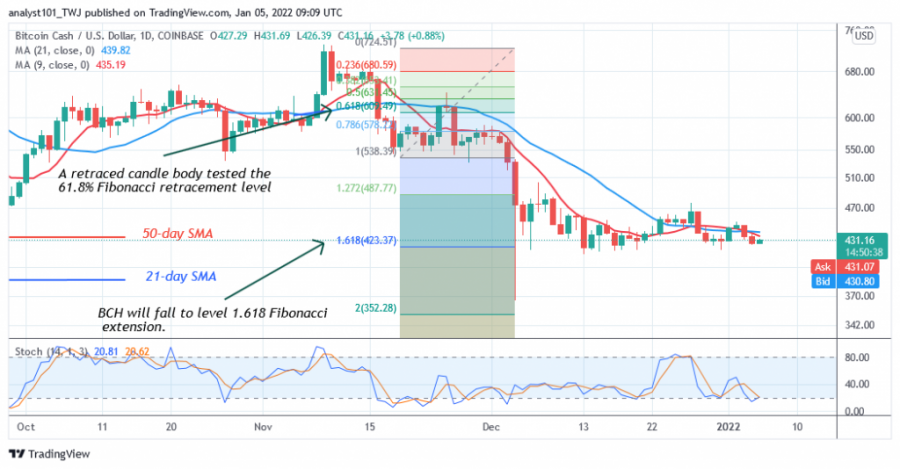
BCH's price bars are below the 21-day line and the 50-day moving averages, indicating a possible decline. Also, the altcoin is at level 41 of the Relative Strength Index for period 14. BCH is in the downtrend zone and could fall. BCH is above the 25% area of the daily stochastic. The cryptocurrency has already fallen into the oversold zone of the market. Buyers are trying to push prices higher.

Technical Indicators
Key Resistance Zones: $800, $820, $840
Key Support Zones: $500, $480, $460
What is the next move for Bitcoin Cash?
Bitcoin Cash is in a downtrend and has reached bearish exhaustion. Meanwhile, on November 19, the downtrend has seen a retracement candlestick testing the 61.8% Fibonacci retracement level. This retracement suggests that BCH will fall to the Fibonacci extension level of 1.618 or the level of $423.37. From the price action, BCH is testing the Fibonacci extension as the price consolidates.

Disclaimer. This analysis and forecast are the personal opinions of the author and are not a recommendation to buy or sell cryptocurrency and should not be viewed as an endorsement by Coin Idol. Readers should do their own research before investing funds.
Price
Price
Price
Price
Price

(0 comments)