Ethereum Gains Support But Struggles Below The $3,800 Level

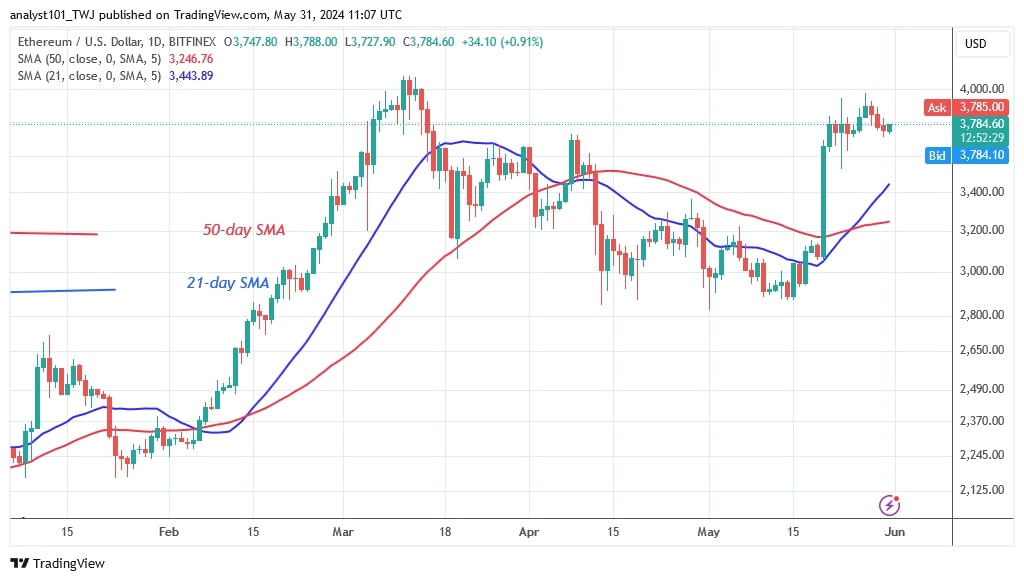
The price of Ethereum (ETH) peaked at a resistance level of $3,944 on May 23. There was a price battle between bulls and bears as the price approached the $3,944 resistance level and the $3,730 break-level support.
Long-term analysis of the Ethereum price: bullish
The bulls took the dips and the price of the cryptocurrency closed at $3,787. The price of the cryptocurrency is currently fluctuating between $3,730 and $4,000. Ether is rising because the breakout support of $3,730 is holding. If buyers break through the $4,000 resistance zone, Ether is expected to rise above its previous high. The bullish momentum will continue to the high of $4,800.
However, the largest altcoin will remain in a range as bulls are pushed back. Ether will fall if the bears break below the $3,730 breakout level. It will fall above the 21-day SMA and eventually break above $3,050. At the time of writing, the exchange rate between ETH and USD was $3,807.
Analysis of the Ethereum indicator
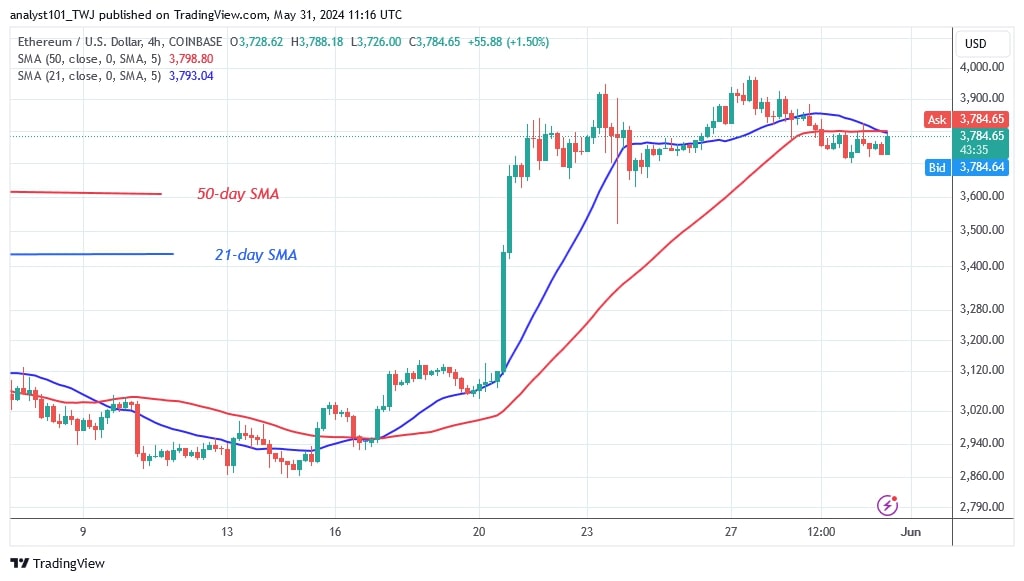
Ether is gaining as it finds support above its breakout level of $3,730. In addition, the price bars are above the moving average lines, accelerating the cryptocurrency's uptrend. The moving average lines on the 4-hour chart are sloping horizontally due to the sideways trend.
Technical indicators:
Key resistance levels – $4,000 and $4,500
Key support levels – $3,500 and $3,000

What is the next direction for Ethereum?
On the 4-hour chart, the price of the cryptocurrency is below the moving average lines. Since May 29, buyers have struggled to push Ether above the moving average lines or the $3,800 level. In addition, the Ether signal is fluctuating due to the sideways trend.

Disclaimer. This analysis and forecast are the personal opinions of the author and are not a recommendation to buy or sell cryptocurrency and should not be viewed as an endorsement by CoinIdol.com. Readers should do their research before investing in funds.
News
News
Coin expert

(0 comments)