Bitcoin Cash Recovers Above $280, Targets above $380 High

Today, BCH is still trading above $380 after the recent downturn. In the last four days, there has been no significant price movement.
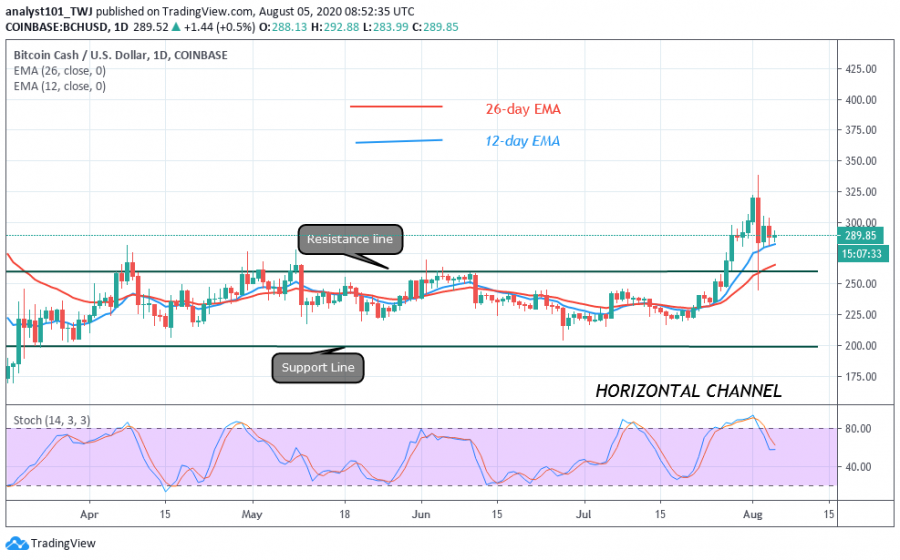
Buyers and sellers are tussling over price above the $280 support. The market seems to be stable as price consolidates in a tight range between $260 and $300. From the recent indicator, buyers may have the upper hand over the sellers.
The advantage buyers have is that BCH is trading in the bullish trend zone. The price is likely to retest the previous highs. On the downside, if sellers suddenly break the $260 support, BCH will fall into the previous price range. Nevertheless, if the sellers have the upper hand, it indicates that the coin lacks buying at higher levels.
Bitcoin Cash indicator reading
The 12-day EMA is acting as support as the price is fluctuating above it. It is an indication of a possible uptrend of the coin. In other words, if the support holds, the coin will rise. The reverse will be the case if the support fails to hold. BCH is in a bearish momentum as the price is below the 80% range of the daily stochastic.

Key Resistance Zones: $440, $480, $520
Key Support Zones: $200, $160, $120
What is the next move for Bitcoin Cash?
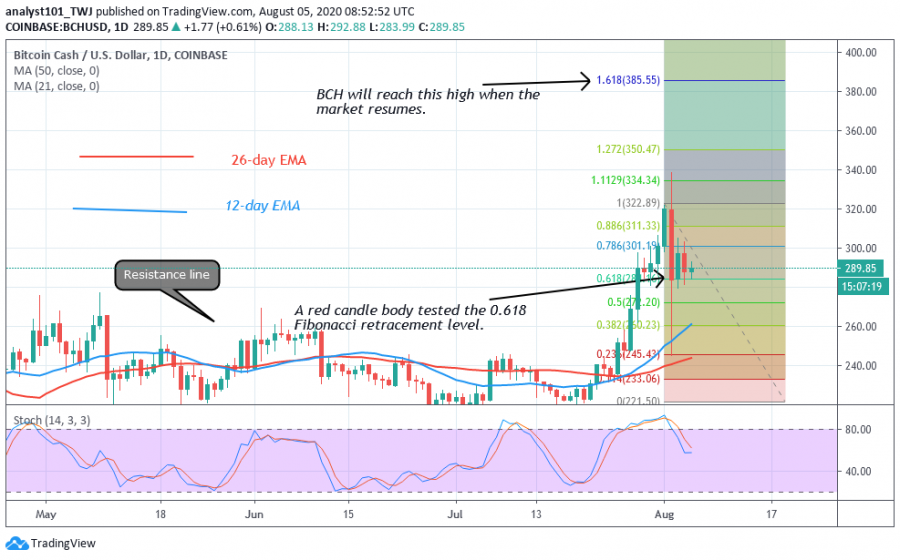
The crypto is trading at $290 at the time of writing. The coin will have accelerated movement if it breaks above the $300 price level. In the recent uptrend on August 1, the coin reached a high of $321. The red candle body retraced and tested the 0.618 Fibonacci retracement level. This explains that BCH is likely to reach the 1.618 Fibonacci extension level. The market will be reaching a high of $380.

Disclaimer. This analysis and forecast are the personal opinions of the author are not a recommendation to buy or sell cryptocurrency and should not be viewed as an endorsement by Coin Idol. Readers should do their own research before investing funds.
Price
Coin expert
News
Price
Price

(0 comments)