Bitcoin Cash Risks Further Decline in Fight Against Resistance at $290

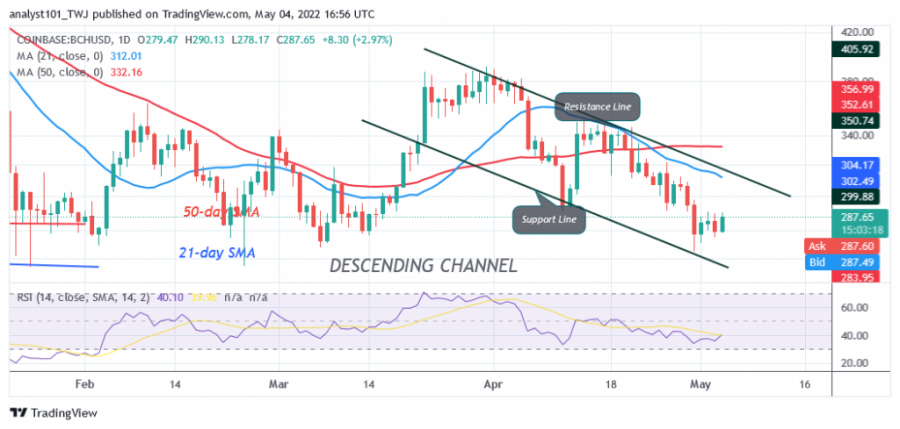
The Bitcoin Cash (BCH) price is in a downtrend as the price hit a low of $267 on April 30. The altcoin has fallen to the historical price level of March 7.
Bitcoin Cash price long-term analysis: bearish
In the last five days, the altcoin has held above the current support. The cryptocurrency will continue its uptrend and regain the previous highs of $340 and $380 if the current support holds.
Currently, the upward movement is hindered by resistance at $290. If the bears get the upper hand, selling pressure will resume, with BCH likely to fall further to the low of $259. On the upside, buyers are struggling to break through resistance at $290. Selling pressure will continue if $290 resistance is not broken.
Bitcoin Cash indicator value
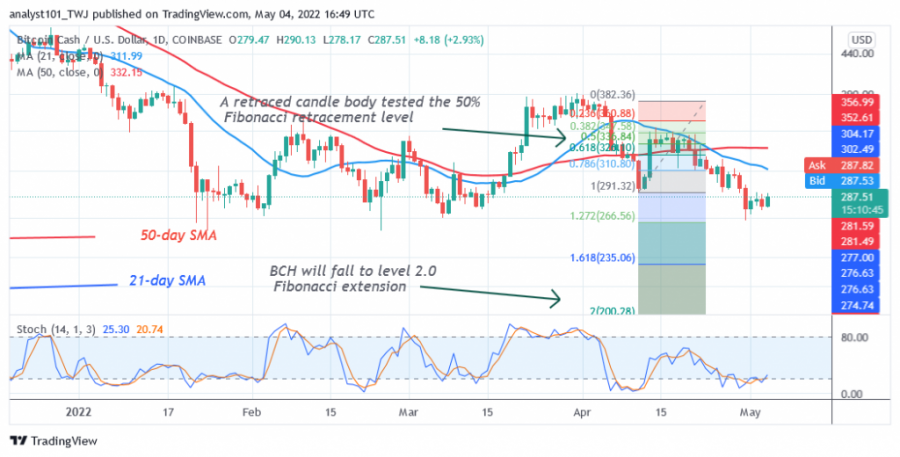
BCH has fallen to the 40 level of the Relative Strength Index for the period 14. The altcoin is in a downtrend and faces rejection at the $290 high. BCH is below the 20% area of the daily stochastic. This indicates that the altcoin has reached the oversold area. Buyers are expected to emerge in the oversold area to push prices higher. The 21-day line SMA and the 50-day line SMA are sloping downwards, indicating a downtrend.

Technical Indicators:
Key resistance zones: $800, $820, $840
Key support zones: $400, $380, $360
What is the next move for Bitcoin Cash (BCH)?
Bitcoin Cash is in a downtrend and the altcoin risks another downward move. Meanwhile, on April 11, the downtrend; a retreating candlestick tested the 50% Fibonacci retracement level. The retracement suggests that BCH will fall to the 2.0 Fibonacci extension level or $200.28.

Disclaimer. This analysis and forecast are the personal opinions of the author and are not a recommendation to buy or sell cryptocurrency and should not be viewed as an endorsement by Coin Idol. Readers should do their own research before investing funds.
News
Price
Price
Price
Price

(0 comments)