Bitcoin Cash Fluctuates Above $320, Targets $480

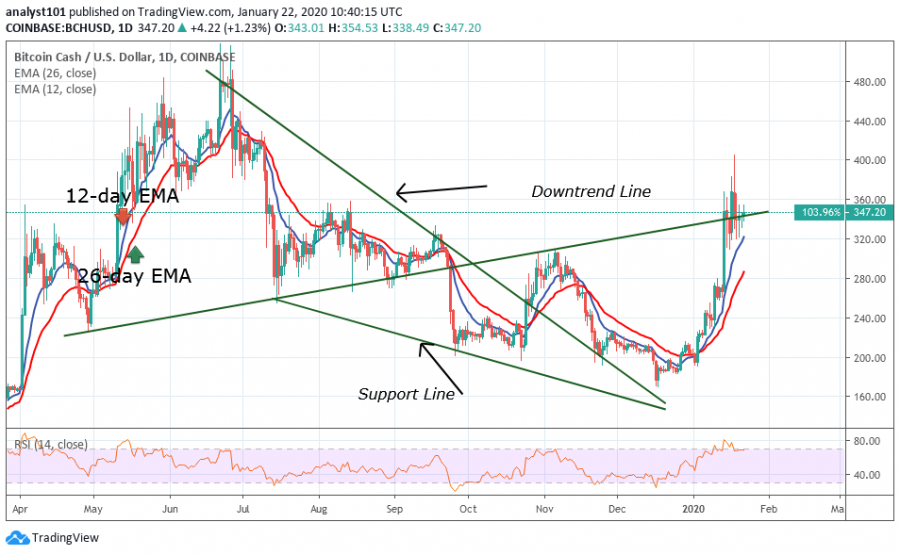
Recently, BCH has been making some remarkable moves to reach higher price levels. On January 14, the bulls reached a high of $360. Again after retracing, the price went up to the high of $403 on January 18. Now, the price has been resisted and it falls to a low of $320. BCH’s uptrend has been hampered as the bulls are bound to a sideways trend.
Meanwhile, if the bulls can move up and break the $360 resistance, a retest above $400 and $440 price levels is possible. Conversely, if the bears have the upper hand and break below $320, BCH will likely drop to the low of $280. Presently, BCH is ranging above $320 pending the direction of the next price movement.
Bitcoin Cash Indicator Reading
BCH is now trading at level 68 of the daily RSI period 14. The coin was previously above level 70 or at the overbought region of the market where sellers came in to push price downward. Nonetheless, the coin is trading in the bullish trend zone. The EMAs are sloping smoothly upward indicating the bullish trend.

Key Resistance Zones: $320, $360, $400
Key Support Zones: $200, $160, $120
What is the Next Direction for Bitcoin Cash?
BCH has followed a tremendous uptrend but is confined between $320 and $360. A break above $360 is expected as it will take BCH out of the downtrend zone. Similarly, a break below $320 will produce a negative effect on the coin. However, Bitcoin will continue the sideways move, if the $320 and $360 price levels remain intact.
Disclaimer. This analysis and forecast are the personal opinions of the author are not a recommendation to buy or sell cryptocurrency and should not be viewed as an endorsement by Coin Idol. Readers should do their own research before investing funds.
Price
Price
Price
Price
News

(0 comments)