Bitcoin Cash Critical Support at $200 May Repel Aggressive Sellers

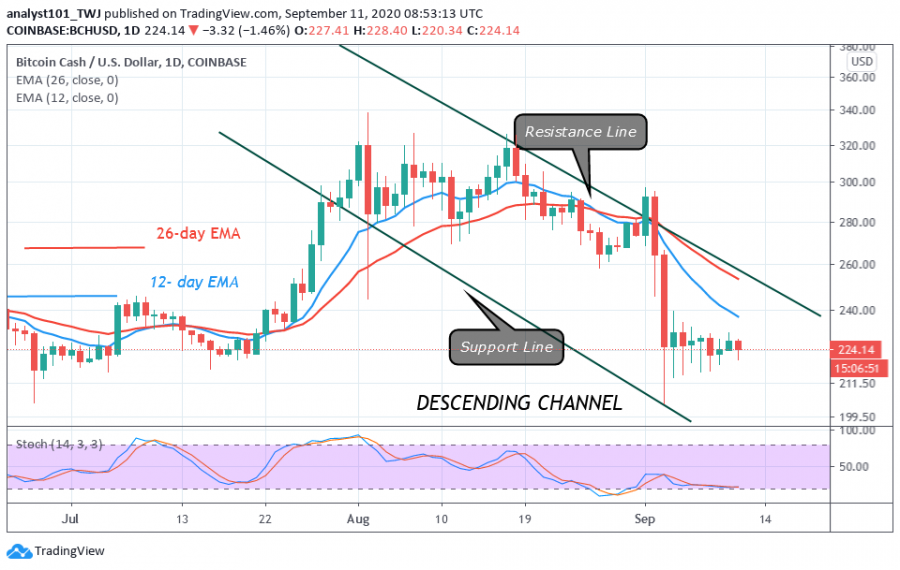
For the past week, Bitcoin Cash has remained in consolidation above the critical support level of $200. There has been no significant price movement as the coin fluctuates between $200 and $240 since September 3.
BCH consolidates with the appearance of small body candlesticks called Doji and Spinning tops. These candlesticks indicate that buyers and sellers are indecisive about the direction of the market.
It is unlikely if the price will break beyond the critical support at $200. It is doubtful because the current support has remained unbroken since March. Nevertheless, if the price does break the $200 support, the market will drop to $178 low. BCH can make an upward move if the current support holds and price rebounds. The uptrend will resume if BCH is pushed above $260 high.
Bitcoin Cash indicator reading
The indicators have remained constant as the coin consolidates in a confined price range. The coin may continue the downward move as price remains below the EMAs. However, BCH will trend upward if the price breaks above the EMAs.

Key Resistance Zones: $440, $480, $520
Key Support Zones: $200, $160, $120
What is the next move for Bitcoin Cash?
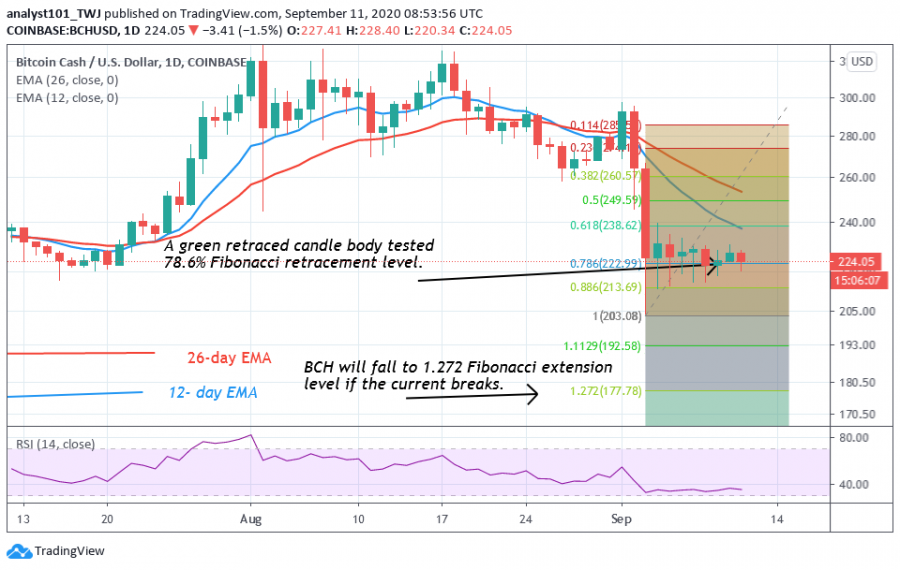
Bitcoin Cash is trading at $223 at the time of writing. The retraced (green candles) tested the 78.6% Fibonacci retracement level. It indicates that BCH will fall to 1.272 Fibonacci extension level or $178 low and later revised. The coin will reverse and return to 78.6 % extension where it originated.

Disclaimer. This analysis and forecast are the personal opinions of the author that are not a recommendation to buy or sell cryptocurrency and should not be viewed as an endorsement by Coin Idol. Readers should do their own research before investing funds.
Price
Price
Price
Price
Price

(0 comments)