Bitcoin Cash is in a Sideways Trend as it Consolidates Above $550 Support

Bitcoin Cash (BCH) is in a sideways trend. Today, BCH is consolidating above $550 support for a possible upside move.
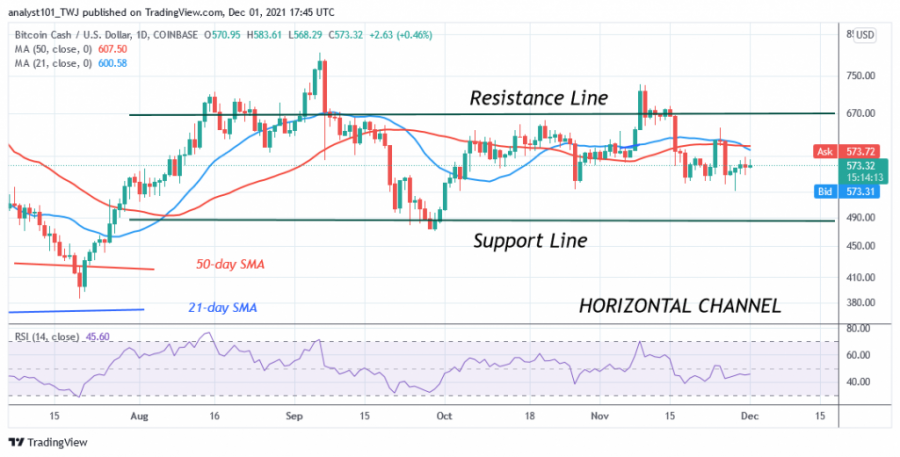
Since August 15, BCH/USD has been struggling to break above resistance at $720. Each time buyers retest the high at $720, BCH falls back into the range zone. Generally, the cryptocurrency is hovering between $510 and $680. The altcoin will resume its uptrend if the bulls break the resistance at $680 and $720. The downtrend will resume if support at $510 is broken. In the meantime, BCH is fluctuating above the $550 support.
Bitcoin Cash indicator reading
BCH is at level 45 on the Relative Strength Index for period 14, with the cryptocurrency price below the moving averages, indicating further downside. The 21-day line and the 50-day line SMA are horizontal, indicating a sideways movement. BCH is above the 30% area of the daily stochastics. This suggests that the market is in a bullish momentum.

Technical Indicators:
Key Resistance Zones: $800, $820, $840
Key Support Zones: $500, $480, $460
What is the next move for Bitcoin Cash?
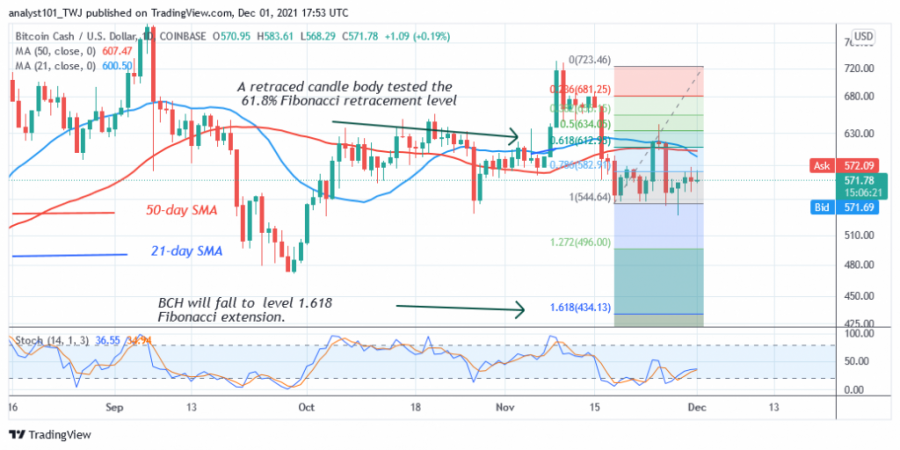
Bitcoin Cash is in a downtrend after throwing back resistance at $720. Meanwhile, on November 18, the downtrend has seen a retreating candlestick testing the 61.8% Fibonacci retracement level. This retracement suggests that BCH will fall to the 1.618 Fibonacci Extension level or $434.13.

Disclaimer. This analysis and forecast are the personal opinions of the author and are not a recommendation to buy or sell cryptocurrency and should not be viewed as an endorsement by Coin Idol. Readers should do their own research before investing funds.
News
Price
PR
Business
Price

(0 comments)