Bitcoin Bulls Buy the Dips as It Holds Above $18,200 Support
Updated: Sep 22, 2022 at 10:48

The price of Bitcoin (BTC) is in a downward correction as the largest cryptocurrency hovers above the $18,200 support.
Bitcoin price long term forecast: bearish
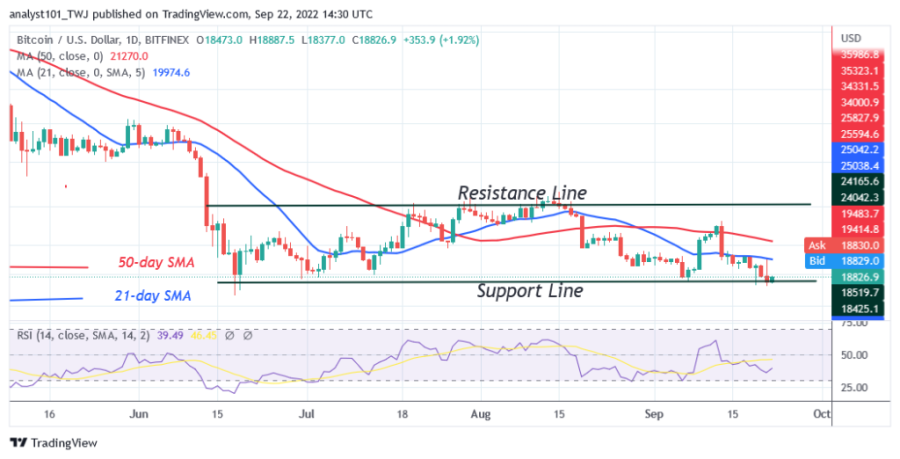
In the last four days, sellers have retested the $18,200 support twice to bring Bitcoin lower. With each retest, the bulls will buy the dips. On the lower time frame, the candlesticks show protruding tails on September 19 and 22.
The long candlesticks show strong buying at lower price levels. On September 19, the BTC price rallied from the $18,200 level but failed to break the $20,000 level. Yesterday, the BTC price resumed its upward correction and regained the previous highs. If buyers push the cryptocurrency above the 21-day line SMA, the BTC price will rise to the 50-day line SMA. However, a break above the moving average lines will catapult the bitcoin price to the upper resistance of $25,205. At the time of writing, BTC/USD is trading at $18,860.
Bitcoin indicator display
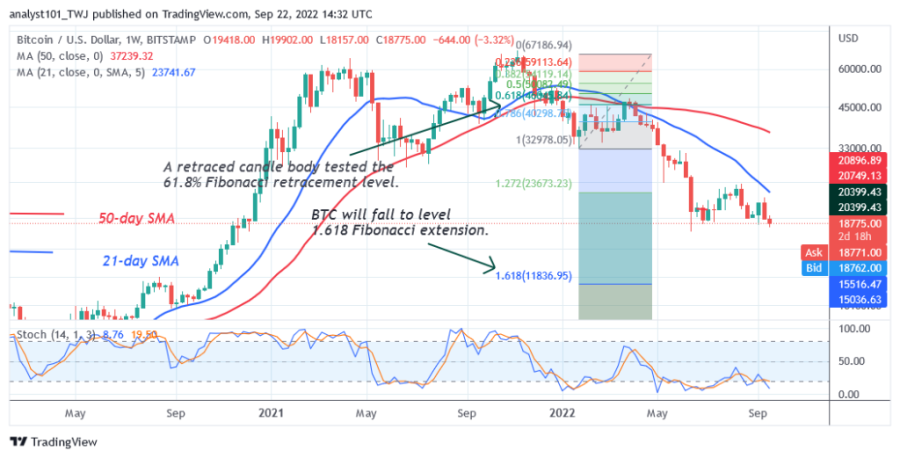
Bitcoin is at level 39 of the Relative Strength Index for the period 14. The cryptocurrency is in the area of the downtrend, while it is trending up again. The 21-day line SMA and the 50-day line SMA are inclined horizontally, indicating a sideways movement. Bitcoin is still below the 20% area of the daily stochastic. The lower price levels are expected to attract buyers.

Technical Indicator
Major resistance zones: $30,000, $35,000, $40,000
Key support zones: $25,000, $20,000, $15,000
What is the next direction for BTC/USD?
Bitcoin is trading below the moving average lines, which makes it vulnerable to a decline. Buyers have defended the current support twice, while sellers are trying to break the $18,200 support. Today, bitcoin is moving up. The upward movement will accelerate if the price rises above the 21-day line SMA. However, the downtrend will continue if the sellers break the $18,200 support.

Disclaimer. This analysis and forecast are the personal opinions of the author and are not a recommendation to buy or sell cryptocurrency and should not be viewed as an endorsement by CoinIdol. Readers should do their own research before investing in funds.
Price
Price
News
Coin expert
Price

(0 comments)