Bitcoin Struggles above $9,900, a Breakdown Is Unavoidable Below $9,900

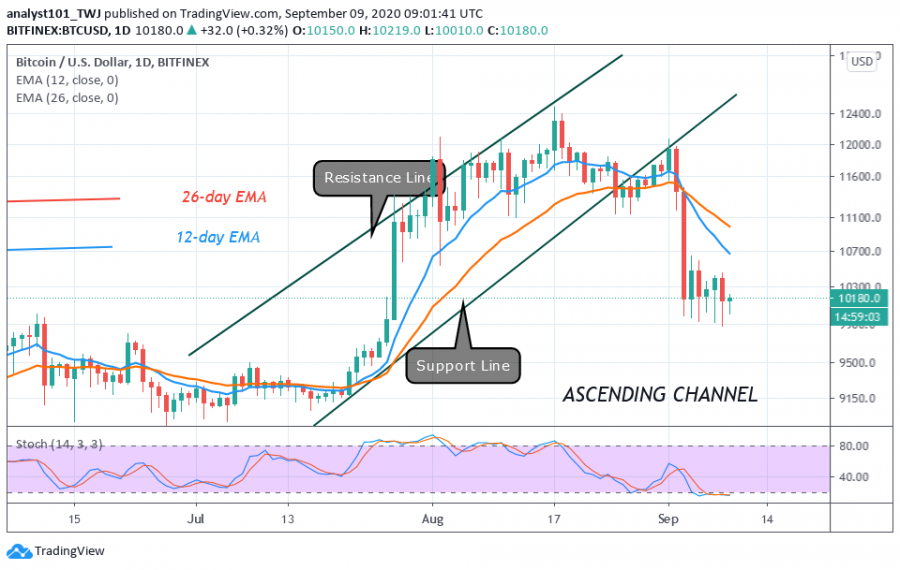
Bitcoin price has continued to hover above the $10,000 support for the past one week. Yesterday, BTC slumped to $9,960 but corrected upward immediately.
This is an indication that buyers are consistently defending the current support for the past week. This can be confirmed by the candlesticks' long tails pointing downward.
Unfortunately, buyers have not been able to push BTC above $10,600 resistance. In the meantime, BTC is range-bound between levels of $10,000 and $10,600.There is a likelihood that the support level can be weakened after several repeated tests at the support. On the downside, if the psychological support level cracks, BTC will slump to $9,800 before reaching the low of $9,400. Today, Bitcoin is still fluctuating above $10,000 support as it trades above $10,100.
Bitcoin indicator reading
Bitcoin is below the 20% range of the daily stochastic but the bands are sloping horizontally. Buyers are yet to emerge in the oversold region of the market as price movement remains static. The EMAs are pointing southward indicating the downtrend.

Key Resistance Zones: $10,000, $11,000, $12,000
Key Support Zones: $7,000, $6,000, $5,000
What is the next direction for BTC/USD?
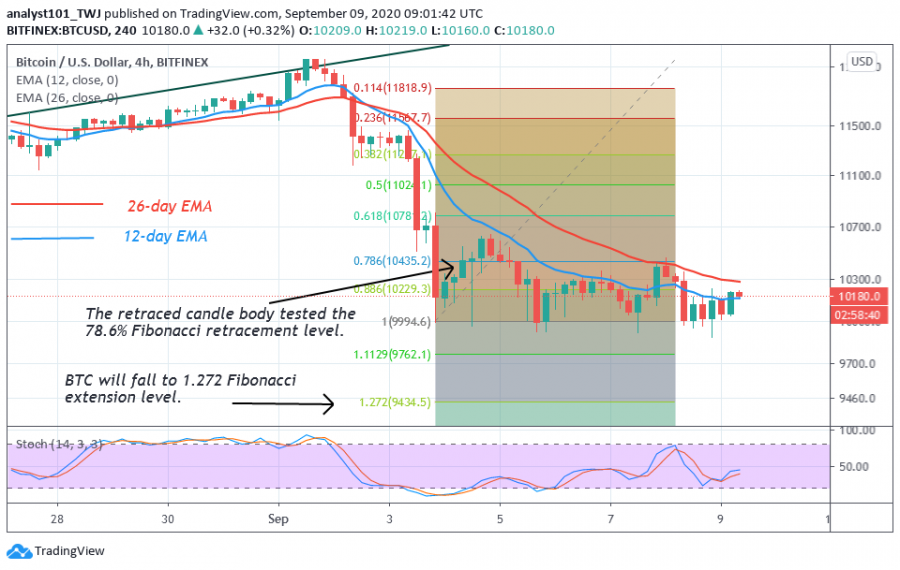
A further downward movement of the coin depended upon a convincing breaking of the $10,000 support. On September 3 downtrend, the last retraced candle body tested the 78.6% Fibonacci retracement level. This candlestick explains that BTC will fall and reach the low 1.272 Fibonacci extension level. That is the market will reach a low of $9,460.

Disclaimer. This analysis and forecast are the personal opinions of the author that are not a recommendation to buy or sell cryptocurrency and should not be viewed as an endorsement by CoinIdol. Readers should do their own research before investing funds.
Coin expert
Price
Coin expert
Price
Price

(0 comments)