Bitcoin Approaches The $26,000 Mark And Faces Another Slump
Updated: Sep 25, 2023 at 13:07

Cryptocurrency price analysis brought by Coinidol.com. Bitcoin (BTC) price failed to rise above the 50-day line SMA or resistance at $27,486.
Bitcoin price long term forecast: bearish
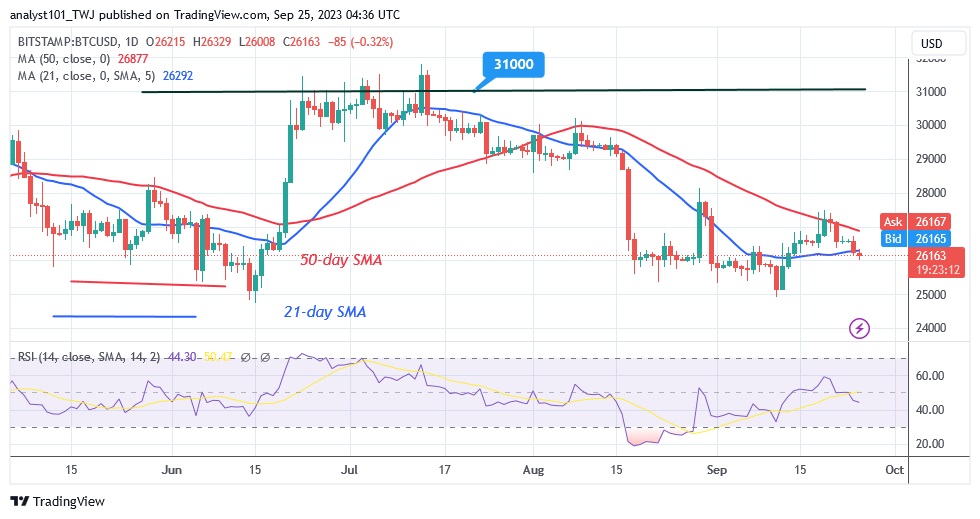
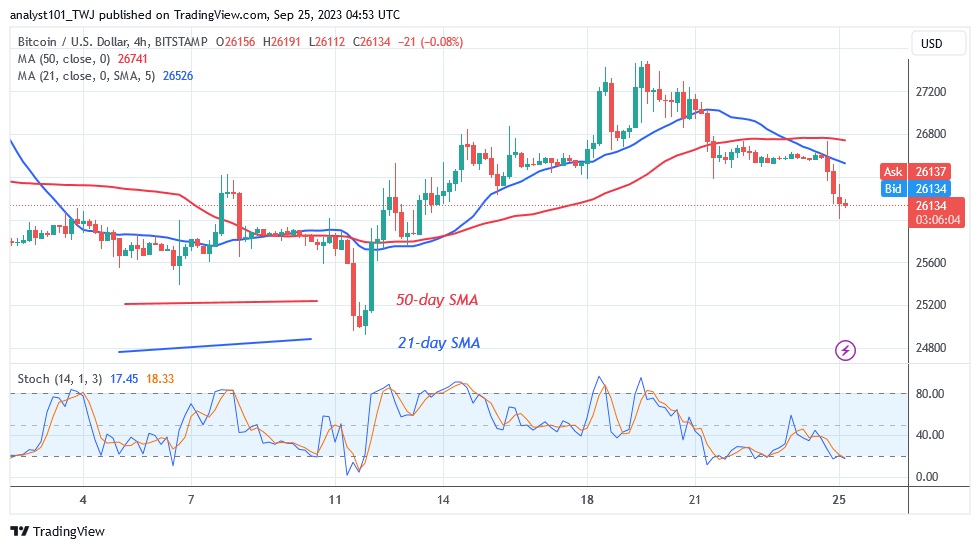
Bitcoin was between the moving average lines when it rose to the $27,486 resistance level during the price action. Bitcoin would rally above $28,000 if the bulls succeed. Bitcoin's decline has ended the previous pattern. Today, BTC/USD is trading at $26,132 at the time of writing. The bears have overwhelmed the bulls as the cryptocurrency falls below the moving average lines. On the downside, Bitcoin risks further decline as price bars remain below the moving average lines. Selling pressure will continue if the bears break the $26,000 support. The bearish momentum will extend to the previous low of $24,920.
Bitcoin indicator display
Bitcoin has fallen into the downtrend zone on the Relative Strength Index of 43 for the 14 period. The cryptocurrency asset is vulnerable to further decline as it is in a downtrend. The largest cryptocurrency is in a downtrend below level 20 of the daily stochastic. As the market approaches oversold territory, the downside is nearing bearish exhaustion.

Technical indicators:
Key resistance levels – $30,000 and $35,000
Key support levels – $20,000 and $15,000
What is the next direction for BTC/USD?
Bitcoin has returned to a downtrend after failing to maintain upside momentum above the moving average lines. If the cryptocurrency price stays above the moving average lines, the positive trend will resume. However, the current decline is likely as the cryptocurrency price is below the moving average lines. Nevertheless, the bears need to defend the current support level to avoid another decline.

As we reported on September 23, bulls tried to break the moving average lines on September 19, but failed. The BTC price rose to a high of $27,508 before collapsing.
Disclaimer. This analysis and forecast are the personal opinions of the author and are not a recommendation to buy or sell cryptocurrency and should not be viewed as an endorsement by CoinIdol.com. Readers should do their research before investing in funds.
News
Coin expert
News
Price
Price

(0 comments)