Bitcoin Attempts to Jump the $57,000 Hurdle amidst $60,000 Expectation
Updated: Oct 14, 2021 at 09:43

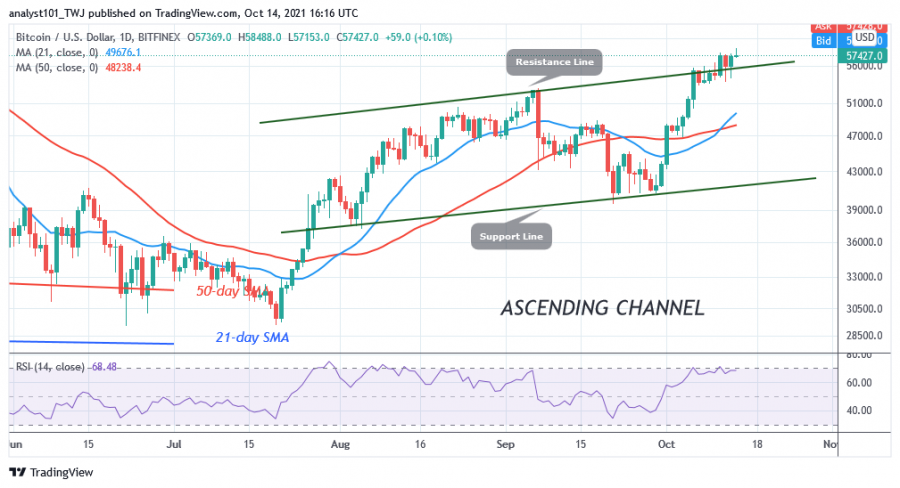
Bitcoin (BTC) price rises to a high of $58,488 today but falls below the $57,000 resistance, with buyers struggling to keep the BTC price above the $57,000 high.
Since October 11, the uptrend has stalled below the recent high. Buyers and sellers are engaged in a price battle as the cryptocurrency pushes towards the previous highs.
On the upside, a break above the $57,000 high will guarantee a rally above the $60,000 psychological price level. Consequently, if buyers fail to hold above the $57,000 high, Bitcoin will fall back to the breakout level at the $52,000 support. However, if the support at $52,000 is broken, the price will continue to fall to the low at $48,000. Meanwhile, the BTC price is fluctuating below and above the high of $57,000. Moreover, the cryptocurrency is trading in the overbought region of the market.
Bitcoin indicator reading
BTC/USD is at level 68 on the Relative Strength Index for period 14, indicating that Bitcoin is approaching the overbought region of the market. The cryptocurrency is considered overbought when it reaches the level of 70. Logically, the scope for an upward rally is limited. Similarly, the BTC price is above the 80% area of the daily stochastic, which confirms that bitcoin is overbought. Therefore, an upside move is doubtful.

Technical indicators:
Major Resistance Levels - $65,000 and $70,000
Major Support Levels - $50,000 and $45,000
What is the next direction for BTC/USD?
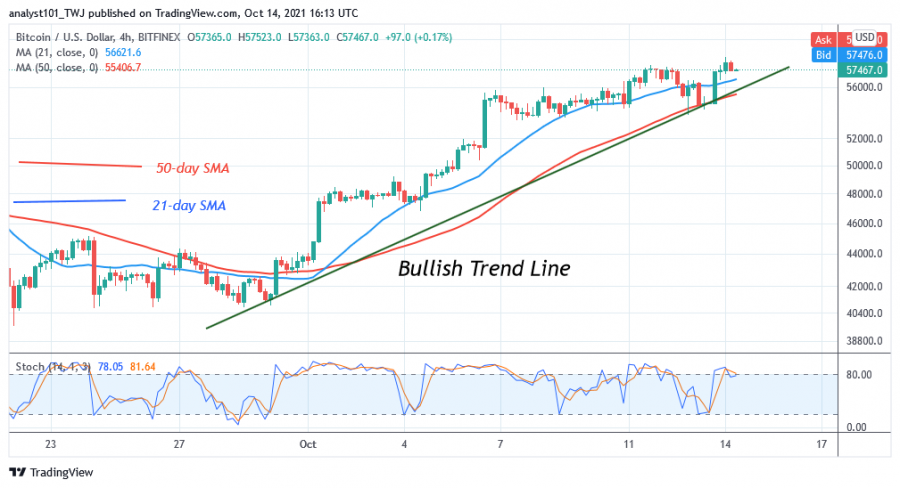
On the 4-hour chart, the BTC price is in a gentle uptrend. The uptrend will continue as long as the trendline remains unbroken. For example, if the price tests the trend line, it will bounce and start rising again. At other times, price will break the trend line and close below it. This suggests that the market will soon reverse. Currently, the price bars are above the moving averages and the trend line.

Disclaimer. This analysis and forecast are the personal opinions of the author and are not a recommendation to buy or sell cryptocurrency and should not be viewed as an endorsement by CoinIdol. Readers should do their own research before investing funds.
Price
Price
News
Price
Price

(0 comments)