Bitcoin Trades Marginally as It Holds Above $19,540 Support
Updated: Sep 05, 2022 at 11:47

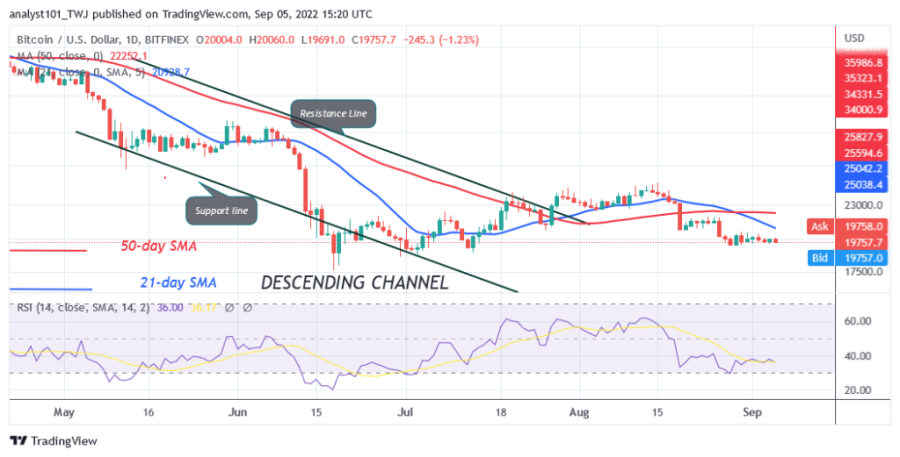
Bitcoin (BTC) is in a downtrend, trading marginally above the $19,540 support. Since August 28, the cryptocurrency has settled between $19,540 and $20,500.
Over the past week, bitcoin has not traded above these price levels. Today, Bitcoin is trading at $19,748 and is approaching the lower price range. The downtrend will continue if sellers break the support at $19,540.
This would send Bitcoin to the lows of $18,638 or 18,912. Bearish momentum could extend to the low of $17,605. The largest cryptocurrency could see a rally if the initial resistances at $20,500 and $21,000 are broken. The BTC price will continue to rise to the upper resistance of $24,000 if the buyers are successful. Today, the price movement is insignificant because there are small indecisive candles called doji.
Bitcoin indicator reading
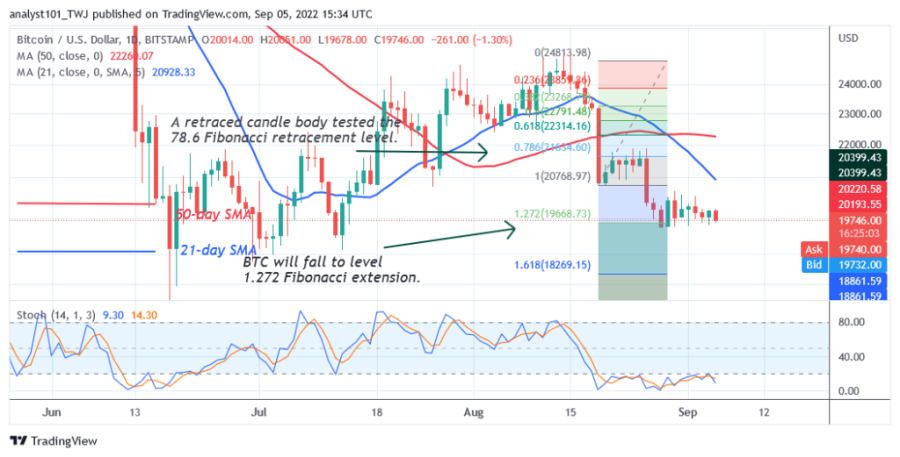
Bitcoin is at the 35 level of the Relative Strength Index for period 14, it is in the downward zone and approaching the oversold area. The other price indicator shows that Bitcoin is below the 20% range of the daily stochastic. This means that the current selling pressure has reached bearish exhaustion. The 21-day line SMA and the 50-day line SMA are sloping south, indicating a downtrend.

Technical indicator
Key Resistance Zones: $30,000, $35,000, $40,000
Key Support Zones: $25,000, $20,000, $15,000
What is the next direction for BTC?
The downtrend has reached bearish exhaustion as Bitcoin consolidates above $19,540 support. Meanwhile, the August 20 downtrend has a candlestick body testing the 78.6% Fibonacci retracement level. The retracement suggests that BTC will fall but reverse at the 1,272 Fibonacci extension level or $19,668.

Disclaimer. This analysis and forecast are the personal opinions of the author and are not a recommendation to buy or sell cryptocurrency and should not be viewed as an endorsement by CoinIdol. Readers should do their own research before investing in funds.
Price
News
Price
News
Price

(0 comments)