Binance Coin Price Experiences Two Rejections, But Remains Solidly Above $300

Binance Coin (BNB) price is bearish between the moving average lines. Price analysis by Coinidol.com.
BNB price long-term forecast: bearish
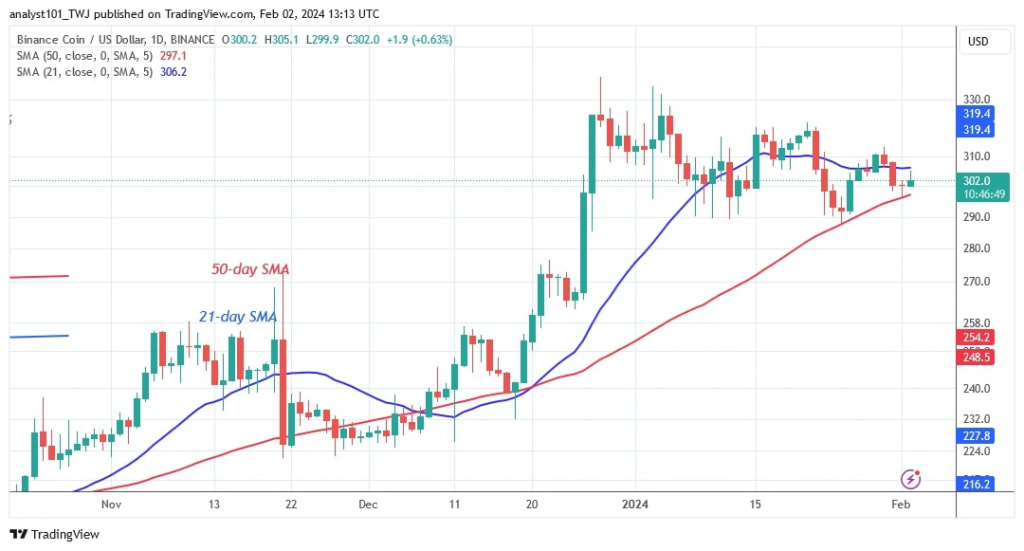
Binance Coin (BNB) has experienced two rejections at the highs of $330 and $310, leading to its decline. BNB is now trading at $300.30. The cryptocurrency remains trapped between the moving average lines. Should the bears break the 50-day SMA to the downside, BNB would drop to a low of $270.
In the meantime, the altcoin is holding above the support level of $300 or the 50-day SMA. Since January 8, buyers have stubbornly supported the existing support level of $290. Long candlestick tails indicate support at $290, suggesting strong buying pressure at the previous low.
BNB indicator reading
The price bars remain between the moving average lines after the rejection at $310. The sideways trend has held the moving average lines horizontally. The price movement was limited by the doji candlesticks.
Technical indicators:
Key resistance levels – $300, $350, $400
Key support levels – $200, $150, $100

What is the next direction for BNB/USD?
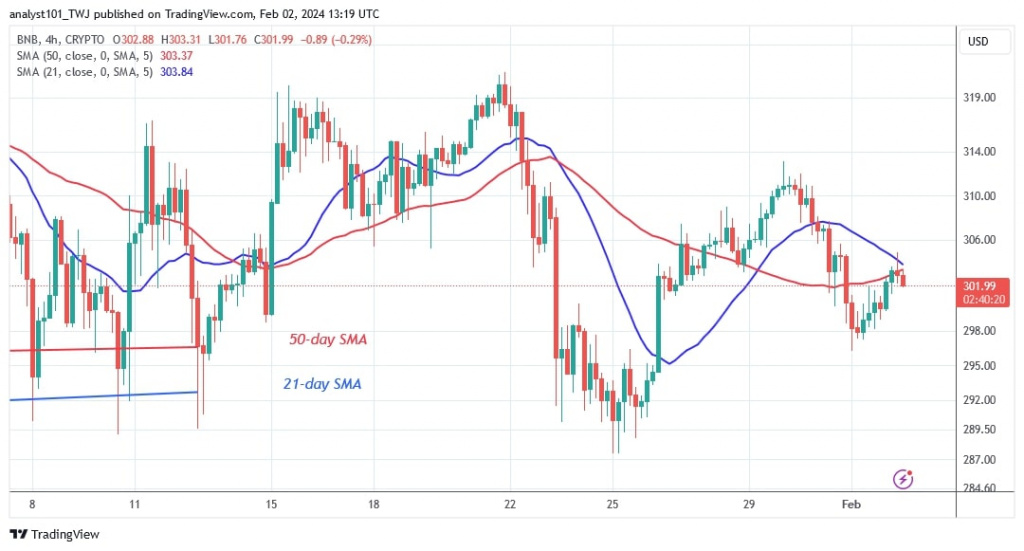
On the 4-hour chart, BNB is still in a sideways trend and falling into a lower price range. On the 4-hour chart, the price movement is limited to the $290 and $311 price levels.
Moreover, doji candlesticks play an important role in characterizing the cryptocurrency value.
Previously on January 19, Coinidol.com reported that on the 4-hour chart, BNB was trading in a narrow range of $290 to $320.

Disclaimer. This analysis and forecast are the personal opinions of the author and are not a recommendation to buy or sell cryptocurrency and should not be viewed as an endorsement by CoinIdol.com. Readers should do the research before investing in funds.
News
Price
Price
Price
Price

(0 comments)