BNB Price Remains stationary And Consolidates Above $320

The Binance Chain Native Token (BNB) price has been in a sideways trend since the end of its uptrend on December 23, 2023.
BNB price long term prediction: range
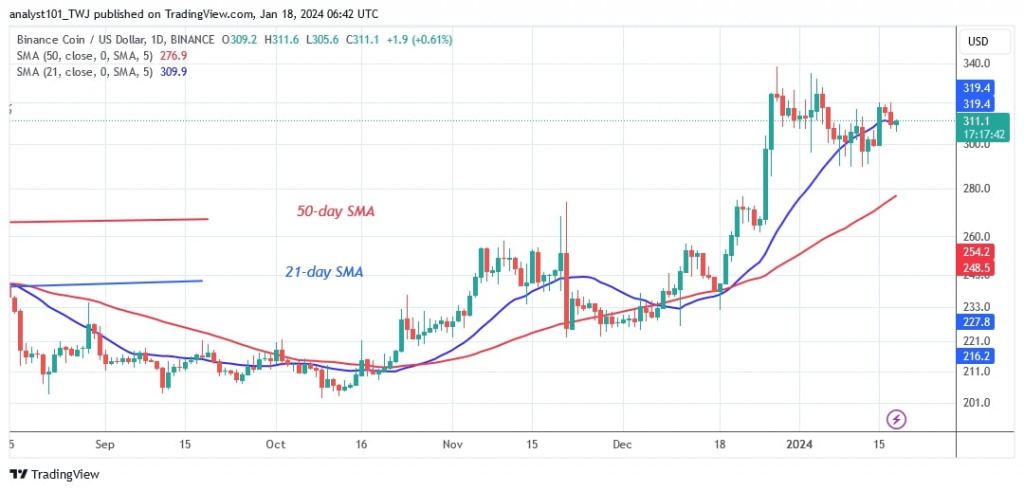
On December 23, 2023, the BNB price rose to a high of $338 before being pushed back. Buyers were unable to sustain the positive momentum above the $340 peak. As a result, BNB was forced to trade sideways in the $290 to $320 price range. Doji candles, which have a small body and are indecisive, have slowed price action for more than two weeks. These candles show traders' indifference to market direction.
On the upside, candlestick wicks point to the recent high, indicating strong selling pressure near the $340 level. BNB will fall above the $280 support or the 50-day SMA if the 21-day SMA is breached. The value of BNB today is $312.30.
BNB indicator reading
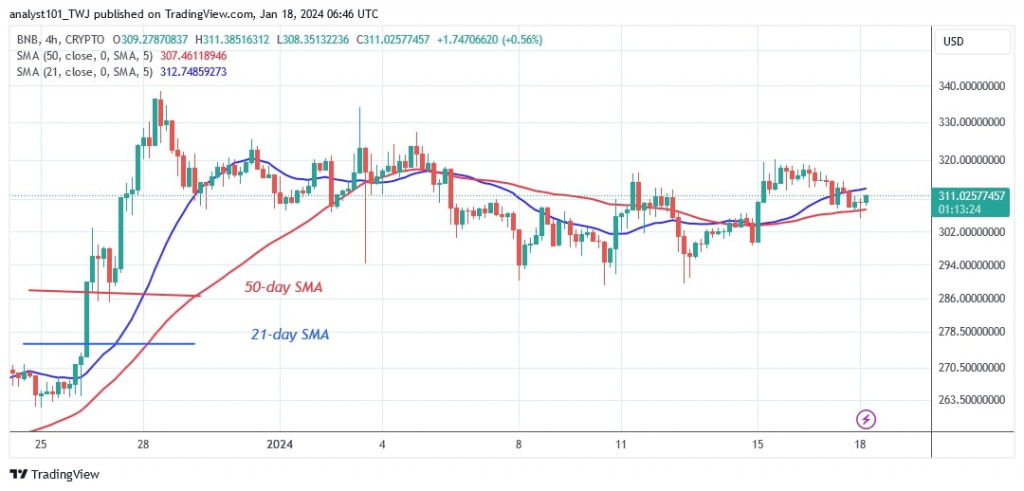
The price bars are above the upward moving average lines. The price action has remained static above the moving average lines. On the 4-hour chart, the moving average lines are sloping horizontally, indicating a sideways trend.
Technical indicators:
Key resistance levels – $300, $350, $400
Key support levels – $200, $150, $100

What is the next direction for BNB/USD?
On the 4-hour chart, BNB is trading in a narrow range of $290 to $320. The price of the cryptocurrency encountered resistance at $320 before slipping between the moving average lines. The bottom line is that BNB will continue to fluctuate within its range.

Disclaimer. This analysis and forecast are the personal opinions of the author and are not a recommendation to buy or sell cryptocurrency and should not be viewed as an endorsement by CoinIdol.com. Readers should do the research before investing in funds.
Price
News
Price
Price
News

(0 comments)