Binance Coin Price Takes A Break And Prepares For An Upswing

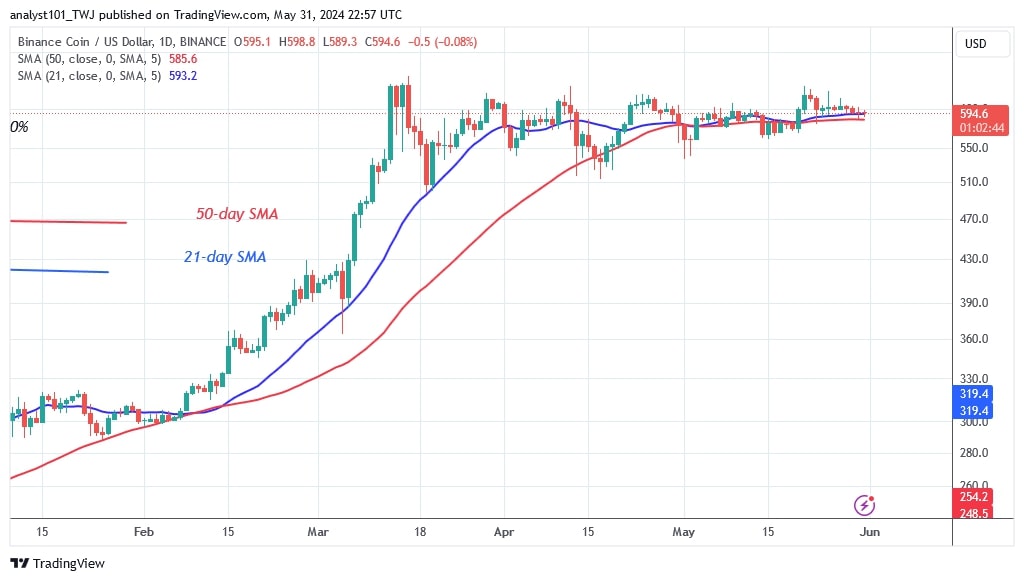
The price of the Binance coin (BNB) is currently in a turbulent phase in which the price movement remains constant. There are no discernible support or resistance levels.
Long-term forecast for the BNB price: fluctuating
The indecisive candlesticks of the small body have caused the price movement to remain immobile. The bulls have not managed to push the price of the cryptocurrency above the upper barrier of $635. Since May 21, the bears have failed to push the price below the moving average lines, as reported by Coinidol.com previously. The current exchange rate between BNB and USD is $593.90.
Nevertheless, the bulls have an advantage as the BNB is currently trading in a positive trend zone. A price rise above the moving average lines will push the altcoin above the upper resistance of $635. The positive momentum will continue up to the high of $692.
BNB indicator reading
The price bars with tiny candlesticks appear above the horizontal moving average lines. These candlesticks have stalled the price of the cryptocurrency. BNB is approaching the possibility of a price rise. Currently, the price decline has fallen above the moving average lines.
Technical indicators:
Key resistance levels – $600, $650, $700
Key support levels – $400, $350, $300

What is the next direction for BNB/USD?
On the 4-hour chart, BNB has dropped below the moving average lines. The decline has reached bearish exhaustion. However, the uptrend has stalled at the moving average lines. A break above the moving average lines will result in the cryptocurrency retesting the overhead resistance level. If the altcoin does not recover, the current consolidation above the moving average lines will continue.

Disclaimer. This analysis and forecast are the personal opinions of the author and are not a recommendation to buy or sell cryptocurrency and should not be viewed as an endorsement by CoinIdol.com. Readers should do their research before investing in funds.
Price
News
Price
Price
News

(0 comments)