Binance Coin Struggles below $480 High, Risks Further Decline

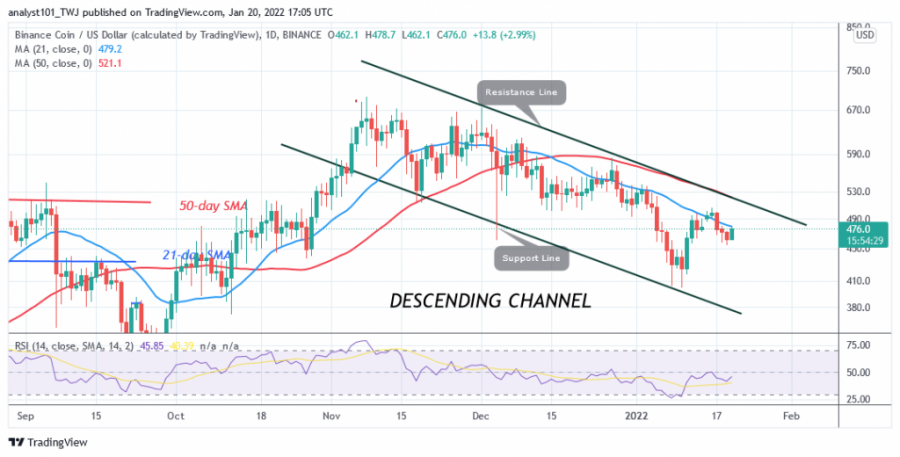
Binance Coin (BNB) price is unable to break through $500 resistance as the altcoin falls below the moving averages.
On the upside, when the buyers have overcome the resistance at $500, it has also risen above the moving average of the 21-day line. The bullish momentum may have extended above the moving average of the 50-day line.
The cryptocurrency has a chance to rise when the price bars are above the moving averages. Now that the cryptocurrency has fallen below the moving averages, the market may continue to fall. The BNB price drops to a low of $453 and corrects to the upside. The upside correction faces another rejection at $480. The downside move is very likely as the altcoin is trading in the overbought zone of the market. The market will go down to the next support at $435.
Binance Coin indicator reading
The altcoin is at level 45 of the Relative Strength Index of period 14. The altcoin is still in the downward zone and below the centre line 50. BNB is in a position to fall to the downside. The price bars of the cryptocurrency are below the moving averages, which makes the altcoin fall. The moving averages of the 21-day line and the 50-day line are down, indicating a downtrend. BNB is above the 80% area of the daily stochastic. The cryptocurrency is in the overbought zone. Sellers will emerge and push prices down.

Technical indicators:
Major Resistance Levels - $700 and $750
Major Support Levels - $400 and $350
What is the next direction for BNB?
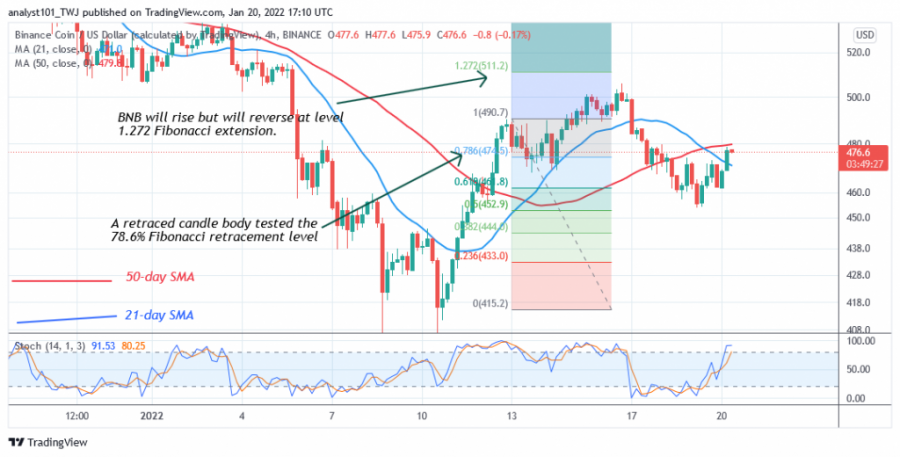
On the 4-hour chart, Binance Coin was previously in an upward correction. The altcoin has declined due to the overbought condition of the cryptocurrency. The price indicator on the chart shows that Binance Coin will rise but reverses at the level of 1.272 Fibonacci extension or $511.20. The price history shows that BNB reached the high of $506 and then reversed.

Disclaimer. This analysis and forecast are the personal opinions of the author and are not a recommendation to buy or sell cryptocurrency and should not be viewed as an endorsement by CoinIdol. Readers should do their own research before investing funds.
Price
Coin expert
News
Price
Price

(0 comments)