Binance Coin Resumes a Sideways Move but Challenges the $300 High
Updated: Nov 12, 2022 at 11:29

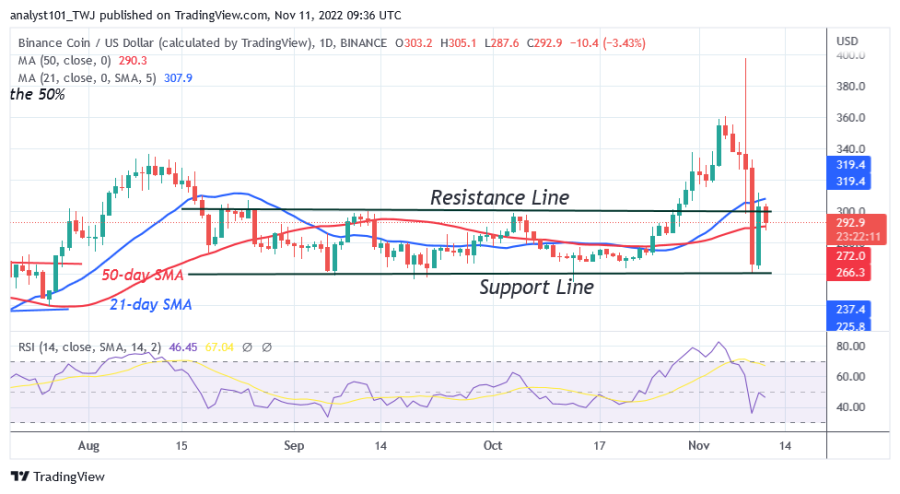
Binance Coin (BNB) price is in a downward movement, fluctuating between moving average lines. On November 4, buyers broke the overhead barrier at $336 and reached the $360 high during the initial rally.
To resume the second uptrend, the BNB price retraced above the moving average. The altcoin reached a high of $400 in November, but quickly fell below the moving average lines. The cryptocurrency price recovered and rose to a high of $400. The price of the cryptocurrency is between the moving average lines. BNB will return to its previous highs of $360 and $400 if buyers keep the price above the 21-day line SMA. If the 50-day line is crossed, BNB will drop down to a low of $260.
Binance Coin indicator reading
For the period 14, BNB is at level 46 on the Relative Strength Index. The price of the cryptocurrency is in a bearish zone and could fall further. The cryptocurrency can continue trading sideways as long as the price bars remain within the moving average lines. Moreover, the horizontal slope of the moving averages indicates a sideways trend. The daily stochastic value of 40 is above the cryptocurrency's price.

Technical indicators:
Major Resistance Levels - $600, $650, $700
Major Support Levels - $300, $250, $200
What is the next direction for BNB?
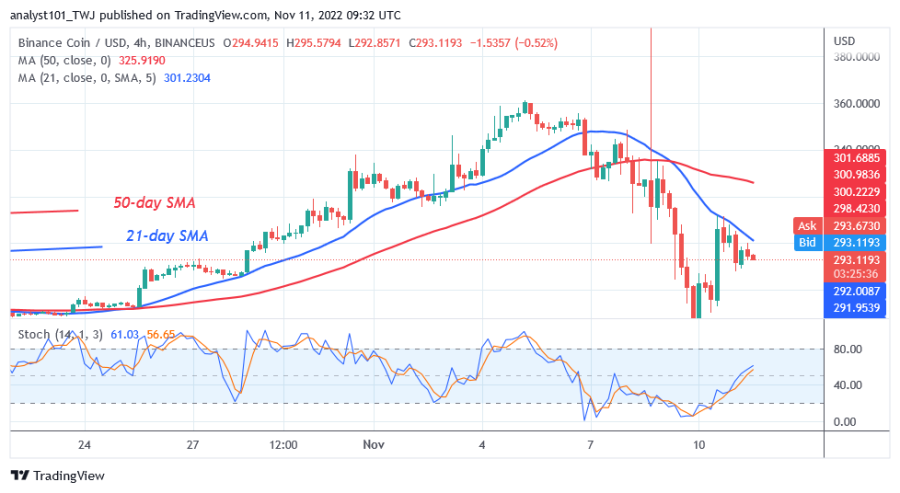
Binance Coin is rejected at the 21-day line SMA on the 4-hour chart. As a result, selling pressure will resume when the altcoin deviates from the moving average lines. At the time of writing, the altcoin is trading for $294. If BNB retraces and holds above the $260 support, the sideways movement will resume.

Disclaimer. This analysis and forecast are the personal opinions of the author and are not a recommendation to buy or sell cryptocurrency and should not be viewed as an endorsement by CoinIdol. Readers should do their research before investing in funds.
Price
Price
Price
Price
News

(0 comments)