Binance Coin Retraces to $21 Support, Attempts Massive Move Soon

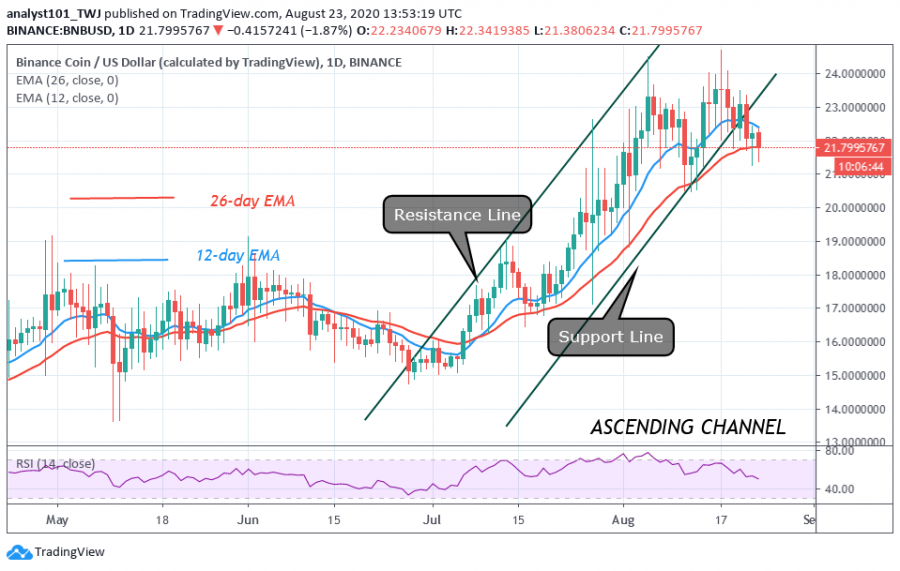
Binance Coin is currently trading at $21 at the time of writing. Buyers have been attempting to break the resistance at $24.
On August 5, the attempt at the resistance resulted in a further downward move. The coin fell to $21 low and resumed upward move. On August 18, BNB retested the resistance, thereby forming a bearish double top. This bearish double pattern is a bearish signal that is responsible for the downward movement of Binance Coin. Meanwhile, the coin has fallen above the $21 support. The upward move will resume if the current support holds.
Binance Coin (BNB) indicator reading
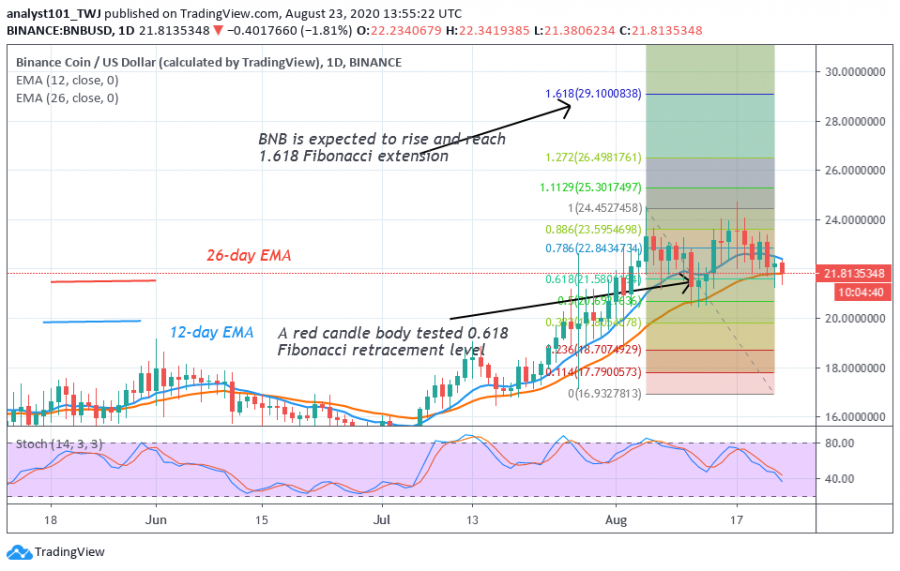
The price broke the EMAs but it is currently finding support above the 26-day EMA. The price will rise if the EMAs hold. The crypto is presently in a bearish momentum as it is below 40% range of the daily stochastic.

Key Resistance Zones: $23, $24, $25
Key Support Zones: $15, $14, $13
What is the next direction for BNB/USD?
Despite the bearish pattern formation and retracement, BNB uptrend is intact. The Fibonacci tool has indicated a further upward movement of the coin. On August 11, a retraced candle body tested the 0.618 Fibonacci retracement level. It indicates that the market will rise to 1.618 Fibonacci extension level or the high of $29.

Disclaimer. This analysis and forecast are the personal opinions of the author are not a recommendation to buy or sell cryptocurrency and should not be viewed as an endorsement by CoinIdol. Readers should do their own research before investing funds.
Coin expert
Price
Price
Price
Coin expert

(0 comments)