Binance Coin Reaches Bullish Exhaustion and Faces Rejection at $320

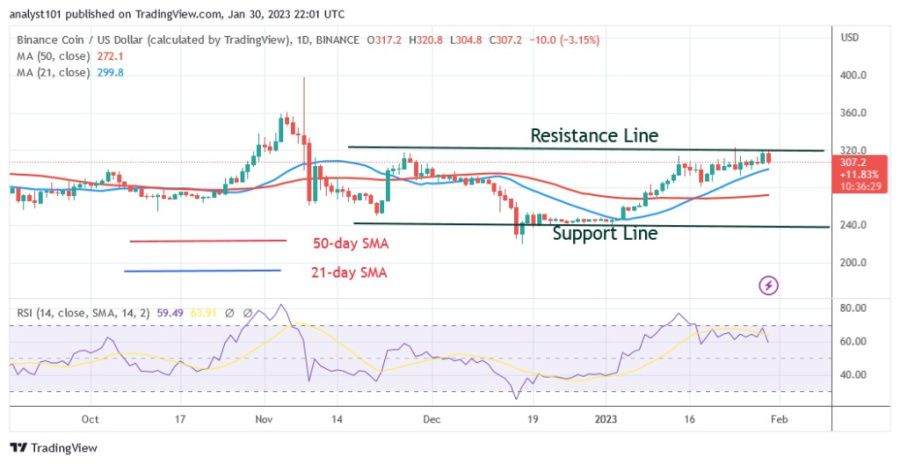
The price of Binance Coin (BNB) has been moving in the zone of uptrend since the beginning of the rise on January 14. After reaching a high of $314, the cryptocurrency's price started to fluctuate below the barrier again.
Binance Coin price long term forecast: bullish
The digital asset is currently in a downtrend after retesting the $320 barrier. However, the uptrend will resume if the recent retracement remains above the 21-day line SMA. If BNB breaks above the $320 resistance, it will continue to rise and retest the overhead resistance at $359. On the other hand, if BNB falls below the moving average lines, it will return to its previous low at $249. At the time of writing, the altcoin is currently trading at $307.90.
Binance Coin indicator display
BNB is declining and is currently at level 59 on the Relative Strength Index for period 14. Since BNB is in the positive trend zone, it is set to rise. The fact that the price bars are higher than the moving average lines suggests that the price of the cryptocurrency will continue to rise. Above level 25 of the daily stochastics, the altcoin is in a bullish momentum.

Technical indicators:
Key resistance levels - $600, $650, $700
Key support levels - $300, $250, $200
What is the next direction for BNB/USD?
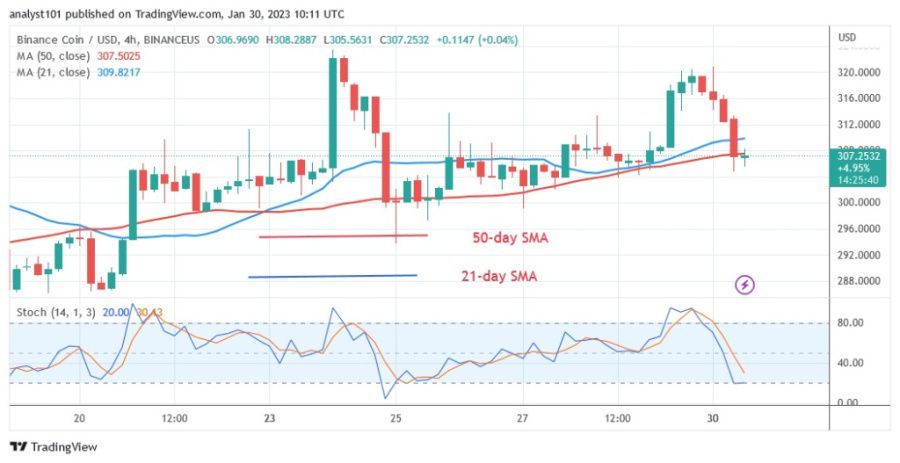
BNB has dipped below the moving average lines on the 4-hour chart, but has risen above the 50-day line SMA. The altcoin is currently between the moving average lines. If it crosses SMA on the 21-day line, the cryptocurrency will gain value. In the meantime, if buyers fail to break the resistance level, the sideways movement could continue.

Disclaimer. This analysis and forecast are the personal opinions of the author and are not a recommendation to buy or sell cryptocurrency and should not be viewed as an endorsement by CoinIdol. Readers should do their research before investing in funds.
Price
Price
Price
Price
Coin expert

(0 comments)