Binance Coin Recovers And Prepares To Jump The $645 Barrier

The price of Binance Coin (BNB) has maintained its uptrend and returned above the 21-day SMA.
Long-term outlook for the BNB price: bullish
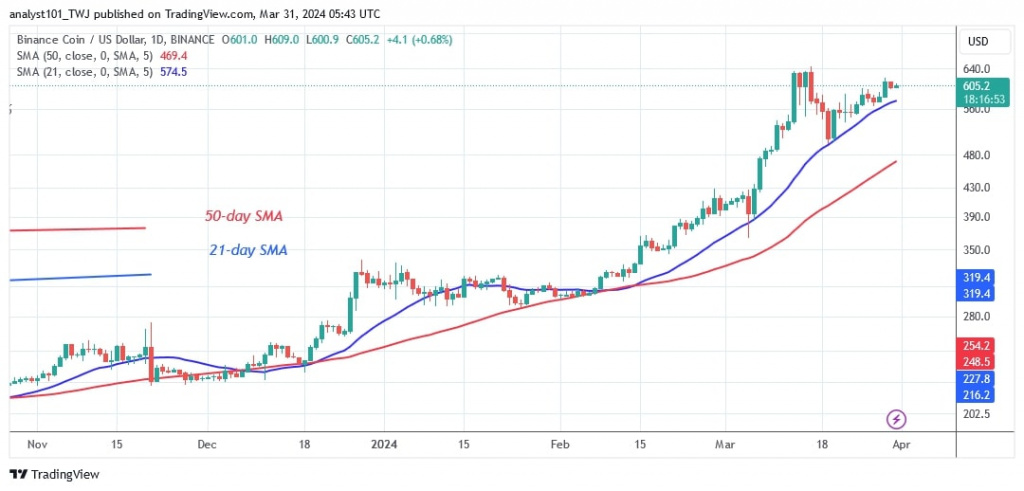
The 21-day SMA support remains intact and points to further upside for the price. An uptrend occurred on March 13, but buyers were unable to break above the $645 peak price.
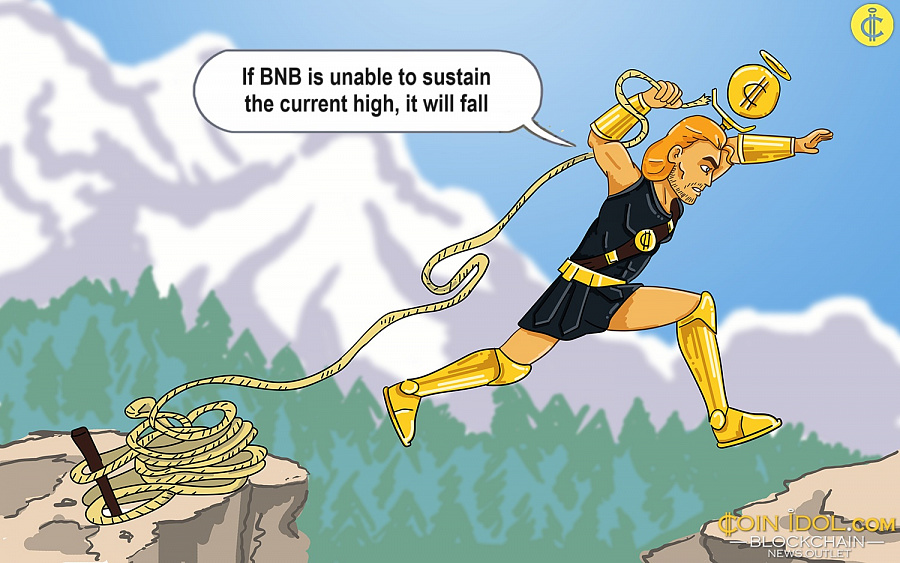
Today, BNB reached a high of $607 in an attempt to break and surpass the $645 resistance. BNB will rise above the overhead resistance of $700 if buyers break above $645. If BNB is unable to sustain the current high, it will fall below the 21-day SMA support. The bears may break below the 21-day SMA and the bearish momentum will continue to the low above the 50-day SMA or $470.
Binance coin indicator reading
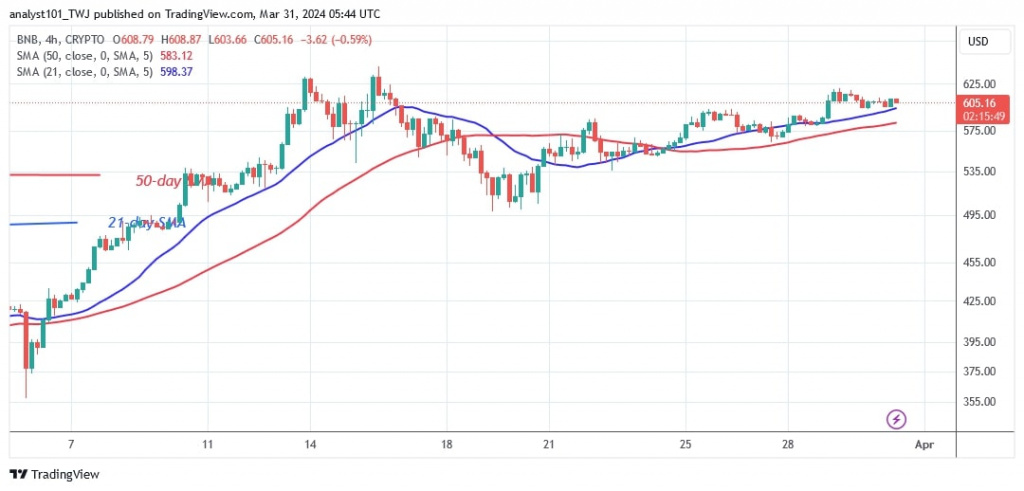
The 21-day SMA is near the price bars, which could lead to a breakdown in the cryptocurrency. On the 4-hour chart, the price bars are above the horizontal moving average lines, indicating a sideways trend. Doji candlesticks have forced the altcoin to remain in a rangebound trend.
Technical indicators:
Key resistance levels – $600, $650, $700
Key support levels – $400, $350, $300

What is the next direction for BNB/USD?
Since March 13, BNB has been in a sideways trend after failing twice at the $645 resistance level. As long as buyers fail to break above the $640 barrier, the cryptocurrency signal will remain range-bound. The doji candlesticks have slowed down the movement of cryptocurrencies.

Disclaimer. This analysis and forecast are the personal opinions of the author and are not a recommendation to buy or sell cryptocurrency and should not be viewed as an endorsement by CoinIdol.com. Readers should do their research before investing in funds.
Price
Price
News
News
Price

(0 comments)