Binance Coin Falls as Buyers Fail to Keep Price Above $403
Updated: May 05, 2022 at 12:46

The downtrend in Binance Coin (BNB) price has eased after reaching the low of $376.
Binance Coin (BNB) price long term forecast: bearish
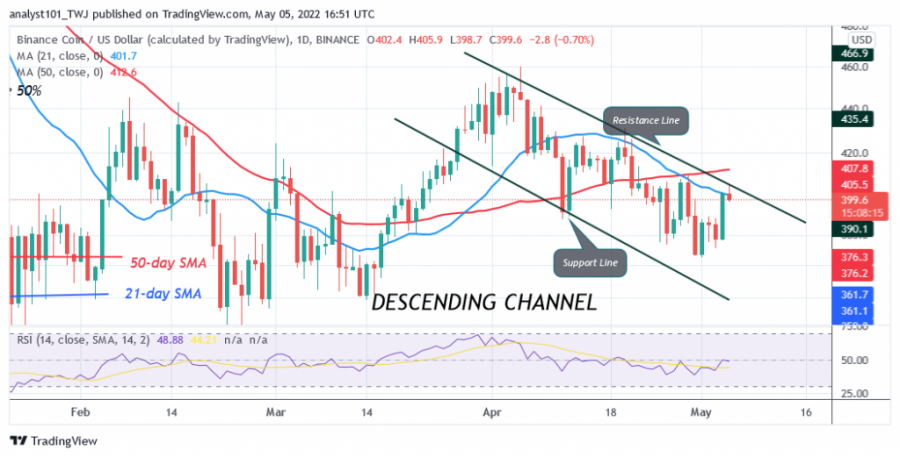
On April 4, the BNB price rallied to the high of $403, but failed to continue the upward momentum. The uptrend was halted at the recent high and the 21-day line SMA. The current uptrend meets resistance at the high of $403.
BNB/USD will come out of a downward correction if buyers overcome the recent high. Initially, the altcoin will recover above the moving averages. In the bullish trend zone, BNB will rise to the highs at $420 and $450. On the other hand, if BNB turns away from the recent high, the cryptocurrency will fall back to the lows of $381 and $376. Meanwhile, BNB has fallen back to the lows of $399.50 as of press time.
Binance Coin (BNB) indicator display
The price of the cryptocurrency is at level 48 of the Relative Strength Index for period 14, indicating that the market is in the downtrend zone and below the centre line 50. The cryptocurrency price is below the moving averages, while the 21-day line SMA acts as resistance. Binance Coin is below the 80% range of the daily stochastic. This indicates that the market is in a bearish momentum.

Technical indicators:
Key resistance levels - $700 and $750
Key support levels - $400 and $350
What is the next direction for BNB/USD?
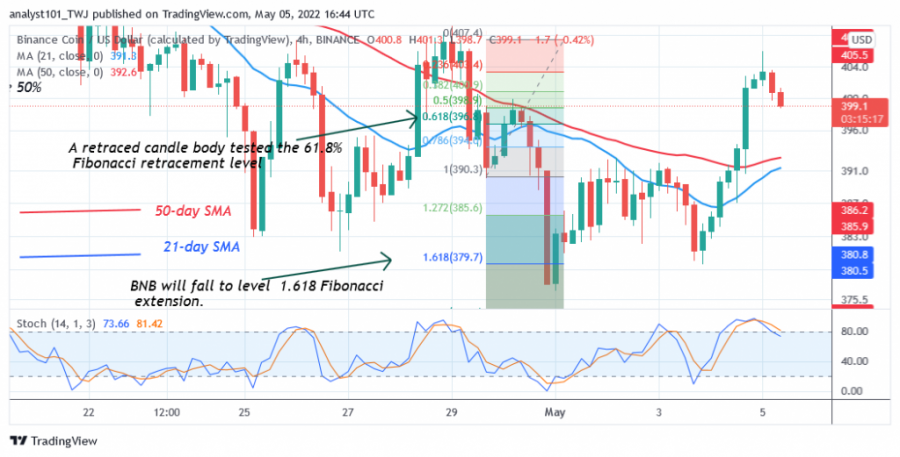
BNB/USD is in a downward correction, but the upside is about to be rejected by the recent high. The altcoin will face renewed selling pressure if it is rejected at the recent high. Meanwhile, the downtrend from April 29 has shown a candle body testing the 61.8% Fibonacci retracement level. The retracement suggests that BNB will fall to the Fibonacci extension level of 1.618 or $379.70. The price action shows that the altcoin retested the level of the 1.618 Fibonacci extension and recovered to the high of $403.

Disclaimer. This analysis and forecast are the personal opinions of the author and are not a recommendation to buy or sell cryptocurrency and should not be viewed as an endorsement by CoinIdol. Readers should do their own research before investing funds.
News
News
Price
Coin expert
Price

(0 comments)