Binance Coin Price Gains Support As Buyers Return Over $595

Binance (BNB) Coin has slipped below the moving average lines after its recent rise to a high of $724.
Long-term forecast for the BNB price: bearish
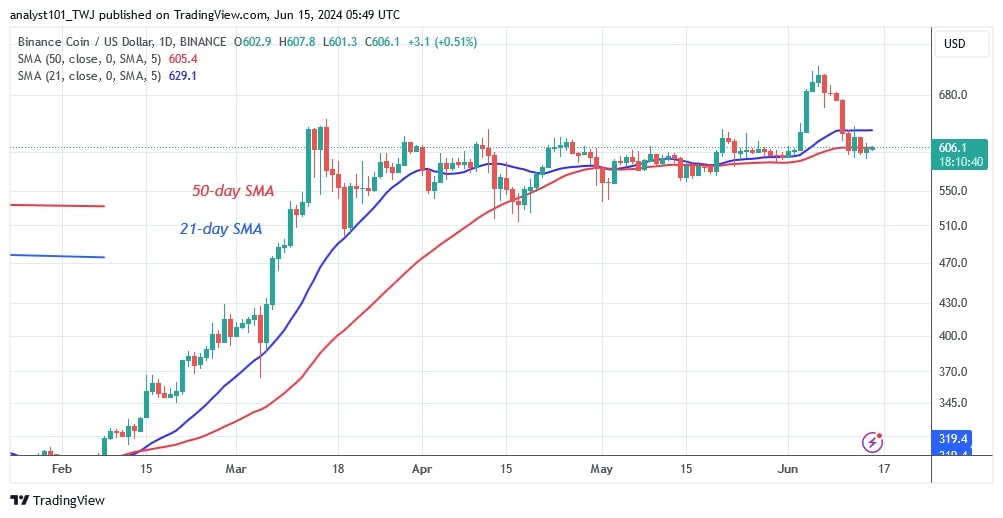
Binance coin price has fallen to a low of $595 as bulls bought the dips. The price of the cryptocurrency corrected upwards but was stopped by the resistance at $635. The current resistance level was the previous breakout support. If the altcoin breaks through the resistance at $635 or rises above the 21-day SMA, it will resume its uptrend.
Currently, the bears have broken below the 50-day SMA to try and drive the cryptocurrency lower. Should the bears succeed, the altcoin will drop to $536. BNB is worth $607.90 at the time of writing.
BNB indicators reading
The price bars were previously below the moving average lines, but the bulls bought the dips. The buyers intend to keep the price above the 50-day moving average line. The bearish scenario will be nullified if the bulls manage to hold above the 50-day moving average lines.
Technical indicators:
Key resistance levels – $600, $650, $700
Key support levels – $400, $350, $300

What is the next direction for BNB/USD?
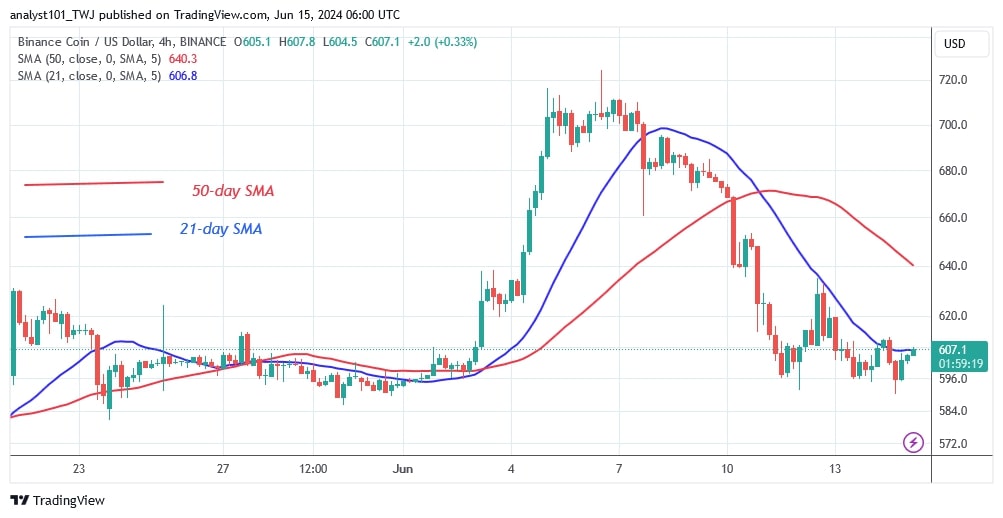
On the 4-hour chart, BNB has fallen below the moving average lines. The altcoin crashed to a low of $595 before trading back above this level. The cryptocurrency's uptrend is hitting a first resistance at the 21-day moving average line.

Coinidol.com reported previously that BNB rose to a high of $725 on June 6 as it entered the bull market. The cryptocurrency price encountered resistance at the recent high but has retraced and found support above the $635 breakout level.
Disclaimer. This analysis and forecast are the personal opinions of the author and are not a recommendation to buy or sell cryptocurrency and should not be viewed as an endorsement by CoinIdol.com. Readers should do their research before investing in funds.
Price
Price
Price
Price
Price

(0 comments)