Bitcoin Cash Struggles Below $300 as Bears Continue to Sell on Every Rally

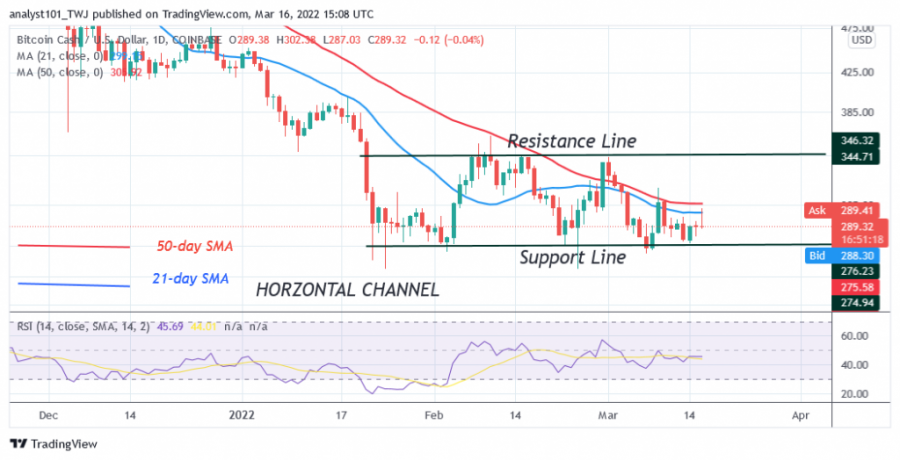
Bitcoin Cash (BCH) price is in a sideways movement as the bulls continue to test the moving averages. At the time of writing, the BCH price is trading at $289.50.
Bitcoin Cash price long-term analysis: bearish
Over the past two months, BCH/USD has fluctuated between $270 and $350. The previous downtrend eased after the January 22 price plunge. BCH fell to a low of $265 and then corrected upward.
The upward correction was stopped at the price level of $362. The altcoin retreated and the subsequent corrections were staved off when BCH fell below the moving averages.
Today, buyers are trying to push the cryptocurrency above the moving averages. BCH will retest the resistance at $340 and $360 if buyers keep the price above the moving averages. On the other hand, BCH will retest the lows of $265 and $259 if the altcoin encounters rejection at the recent high.
Bitcoin Cash indicator reading
BCH is at level 45 of the Relative Strength Index for period 14. The altcoin is in the downtrend zone and below the midline 50. The moving averages of the 21-day line and the 50-day line are sloping horizontally, indicating a sideways trend. BCH is above the 25% area of the daily stochastic. This indicates that the market is in a bullish momentum.

Technical Indicators:
Key Resistance Zones: $800, $820, $840
Key Support Zones: $400, $380,$360
What is the next step for Bitcoin Cash (BCH)?
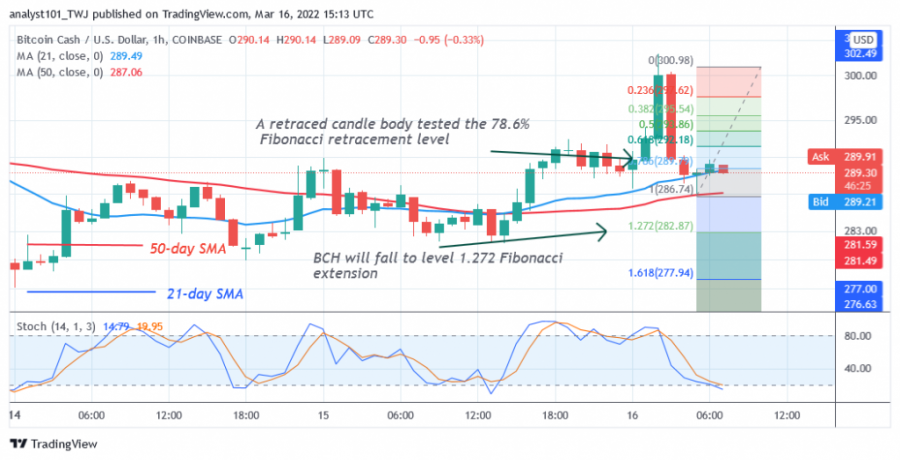
Bitcoin Cash is in a downtrend as the price has reached oversold territory. The altcoin is in a range-bound move as the bulls struggle to get above the moving averages. Meanwhile, on March 16, the downtrend tested the 78.6% Fibonacci retracement level through a candlestick. The retracement suggests that BCH will fall but reverse at the 1,272 Fibonacci extension level or $282.87.

Disclaimer. This analysis and forecast are the personal opinions of the author are not a recommendation to buy or sell cryptocurrency and should not be viewed as an endorsement by Coin Idol. Readers should do their own research before investing funds.
Coin expert
Price
Coin expert
Price
Coin expert

(0 comments)