Weekly Cryptocurrency Market Analysis: Altcoins Show Signs Of Recovery

The worst performing cryptocurrency has recovered at the bottom of the chart. The cryptocurrencies broke through the moving average lines but were stopped by the overhead resistance.
The altcoins are still trading above the moving average lines, indicating a possible rise. We will discuss each of these cryptocurrencies in detail.
PAX Gold
The price of PAX Gold (PAXG) has risen above the moving average lines, signaling an uptrend. The cryptocurrency's value is rising to retest the upper hurdle at $2,000. The altcoin has been forced into a sideways trend since July 27, 2020. The overbought zone has been reached due to the current upswing in the market. Since the overriding resistance has been intact for the past two years, PAXG's recent high could be discarded. For the 14 period, PAXG is currently in positive momentum above level 67 of the Relative Strength Index. Its performance last week was the weakest among all cryptocurrencies. The cryptocurrency's characteristics include:
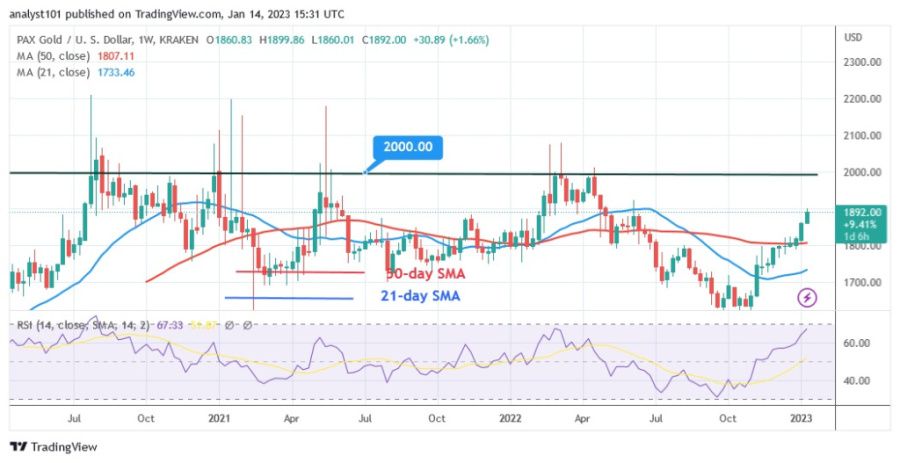
Current price: $1,894.03
Market capitalization: $513,734,174
Trading volume: $20,151,749
7-day gain/loss %: 1.64%
Nexo
NEXO(NEXO) is in an upward correction after a drop to the low of the chart. The altcoin rallied to a high of $0.76 before resuming its oscillation below. If the resistance levels at $0.76 and $0.80 are broken, the altcoin will rise. NEXO will reach a high of $1 in the future. Selling pressure will increase again if the bears break below the moving average lines. The altcoin will fall and return to its previous low of $0.60. It is currently moving above the moving average lines. Below the daily stochastic level of 40, it is in negative momentum. The second worst performance of the week belongs to NEXO. It has the following characteristics:
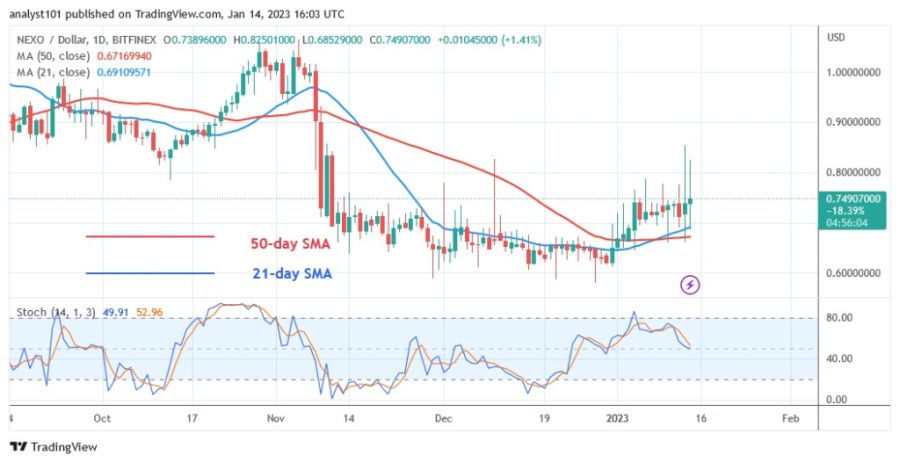
Current price: $0.7373
Market capitalization: $738,103,982
Trading volume: $17,978,258
7-day gain/loss %: 1.97
Bitcoin SV
The price of Bitcoin SV (BSV) is moving sideways but correcting upwards to regain the previous high of $48.0. Since the price decline on November 9, BSV has been moving in a range between $36 and $48. The decline is due to the failure of buyers to keep the price above the $48 resistance level. Buyers have defended the existing support at $36 on the downside. When the trading range boundaries are broken, the altcoin will develop a trend. For the period 14, the BSV is rising above the Relative Strength Index of 56, which means that the altcoin has the potential to rise much further. It is the third worst performance of the week. The cryptocurrency's characteristics include:
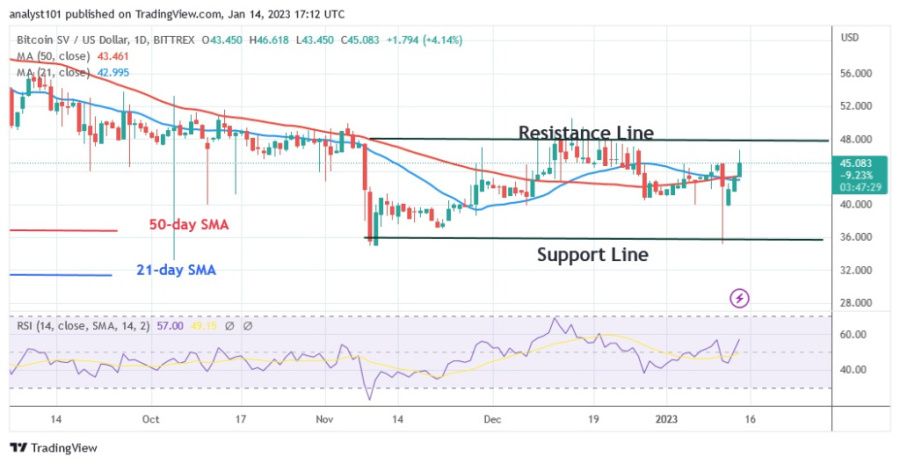
Current price: $45.14
Market capitalization: $948,035,474
Trading volume: $73,299,752
7-day gain/loss %: 4.44%
UNUS SED LEO
UNUS SED LEO (LEO) is losing value and has fallen to the bottom of the price chart. Doji candlesticks have dominated the price movement. At the bottom of the chart LEO is moving in a range. The price of the cryptocurrency drops every time it retests the moving average lines. LEO has been declining since June 27 as buyers have been unable to keep the price above the moving average lines.The recent downturn has pushed the market into the oversold area of the chart. LEO daily stochastic reading is at 20.The chart shows that the market for LEO is heavily oversold. LEO is the fourth worst performing coin. It has the following characteristics:
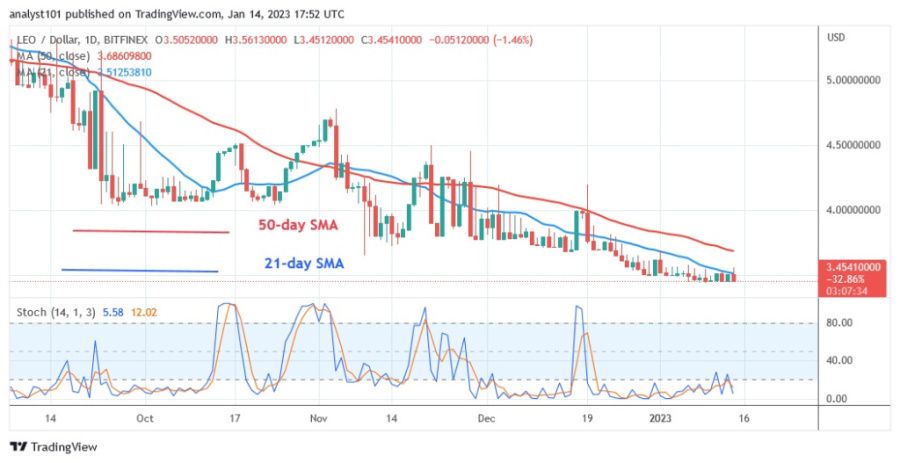
Current price: $3.46
Market capitalization: $3,409,905,960
Trading volume: $2,496,112
7-day gain/loss %: 6.83
Ethereum Classic
Ethereum Classic (ETC) is in an upward correction after crossing the moving average lines. The altcoin rose to a high of $24 before retreating. The overbought zone of the market was reached by the rise. The altcoin will resume its uptrend if it breaks the resistance at $24 and $26 to the upside. If the recent high is not reached, the altcoin could fall back above $20. The overbought area of the market is where the altcoin is currently trading. It is unlikely that ETC will continue to rise. Above the 80 mark of the daily stochastics, the cryptocurrency is in the overbought zone. ETC the fifth worst cryptocurrency has the following characteristics:
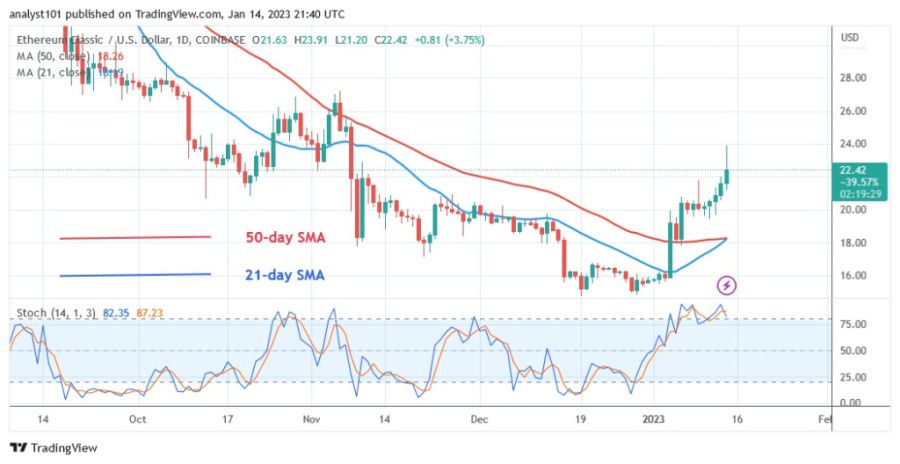
Current price: $22.43
Market capitalization: $4,726,607,100
Trading volume: $565,373,097
7-day gain/loss: 9.62%
Disclaimer. This analysis and forecast are the personal opinions of the author and are not a recommendation to buy or sell cryptocurrency and should not be viewed as an endorsement by CoinIdol. Readers should do their research before investing in funds.
Price
Coin expert
Price
Coin expert
Price

(0 comments)