Weekly Cryptocurrency Market Analysis: Altcoins Consolidate Near Recent Highs In Preparation For An Uptrend

Altcoins are rising above the moving average lines and climbing to new highs.
As altcoins consolidate near resistance levels, the uptrend has currently slowed down. Cryptocurrencies could break out as they fluctuate near resistance levels. Let us take a closer look at some of these alternative coins:
Lido DAO
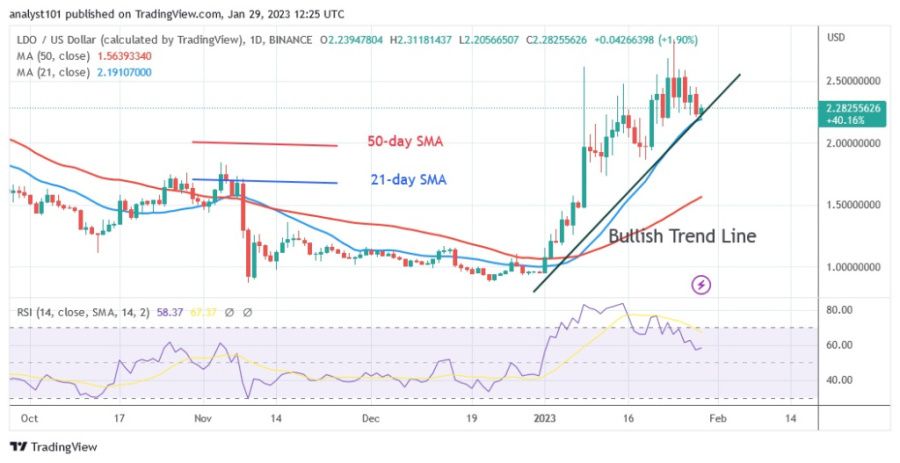
The price of Lido DAO (LDO), which has risen to a high of $2.83, is currently in the uptrend zone. On January 24, the uptrend ended as it was pushed back by the overbought zone of the market. As the altcoin fell back above the moving average lines or the support at $2.20, the current uptrend could be resumed. The altcoin is currently bouncing below the $2.50 resistance level. If the current resistance is broken, LDO will rise to its previous high. However, the cryptocurrency's price will fall if it breaks the moving average lines. On the downside, the altcoin will fall to its lows of $1.00 and $1.20. LDO is currently trading at the 58 level of period 14 of the Relative Strength Index. This indicates that it is in a bullish trend zone and has the potential to rise. It is the cryptocurrency that performs the worst. The cryptocurrency's characteristics include:
Current price: $2.29
Market capitalization: $2,291,277,464
Trading volume: $2,291,277,464
7-day gain/loss %: 10.40%
Hedera
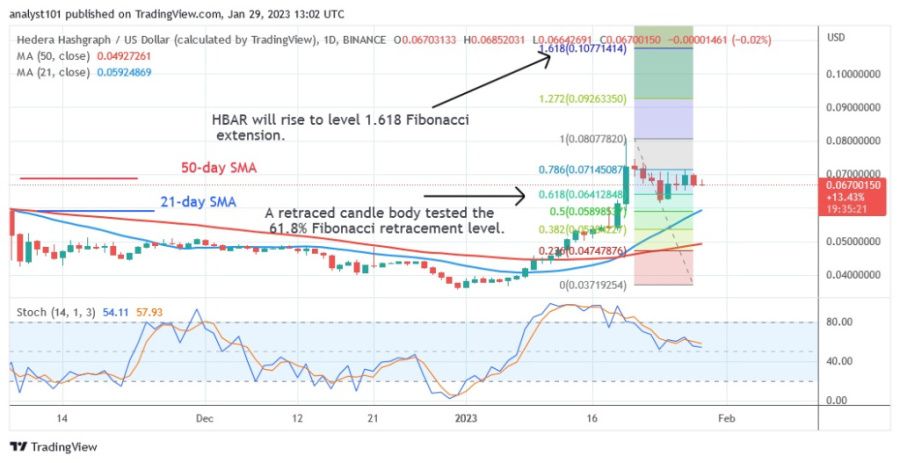
Hedera (HBAR) is currently trading in the bullish trend zone with prices below the $0.07 resistance level. Since January 20, the altcoin has been moving back in a range, and the upward momentum has waned. If the price breaks through the $0.07 resistance, the uptrend will resume. A retraced candlestick of the uptrend from January 20 tested the 61.8% Fibonacci retracement level. According to the retracement, HBAR will rise to the 1.618 Fibonacci extension level or $0.10. Below the daily stochastic level of 60, HBAR has bearish momentum. The altcoin had the second worst weekly performance of all cryptocurrencies. The cryptocurrency's characteristics include:
Current price: $0.06704
Market capitalization: $3,351,429,690
Trading volume: $22,870,953
7-day gain/loss %: 9.67%
Maker
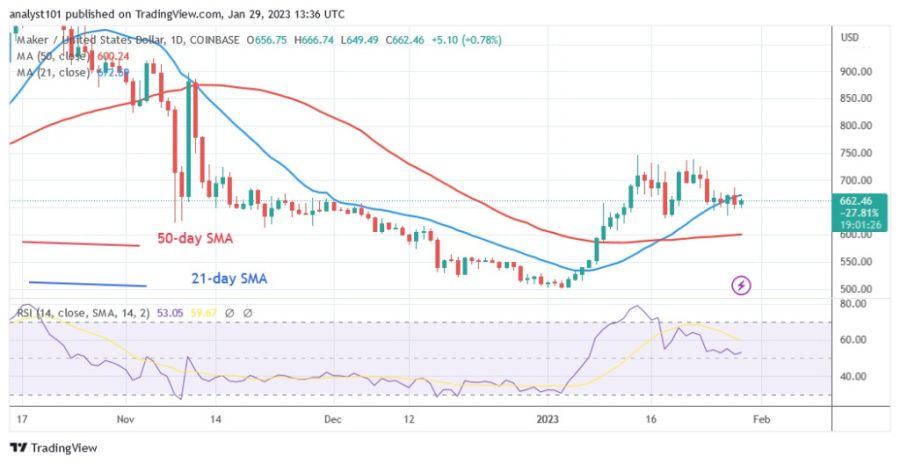
The price of Maker (MKR) has crossed the moving average lines, signaling an upward correction. The $750 resistance zone marks the end of the upward correction. Buyers were not able to keep the price above the resistance level since January 14. As a result, the altcoin has fallen below the 21-day line SMA, but above the 50-day line SMA. It follows that Maker will be forced to make a move that lies between the moving average lines and is bound by a range. When the range boundaries are crossed, the cryptocurrency starts to trend. For the period 14, Maker is at 53 on the Relative Strength Index. The cryptocurrency with the third worst performance, MKR, has the following characteristics:
Current price: $662.20
Market capitalization: $665,822,594
Trading volume: $19,999,993
7-day gain/loss %: 9.22%
Sandbox
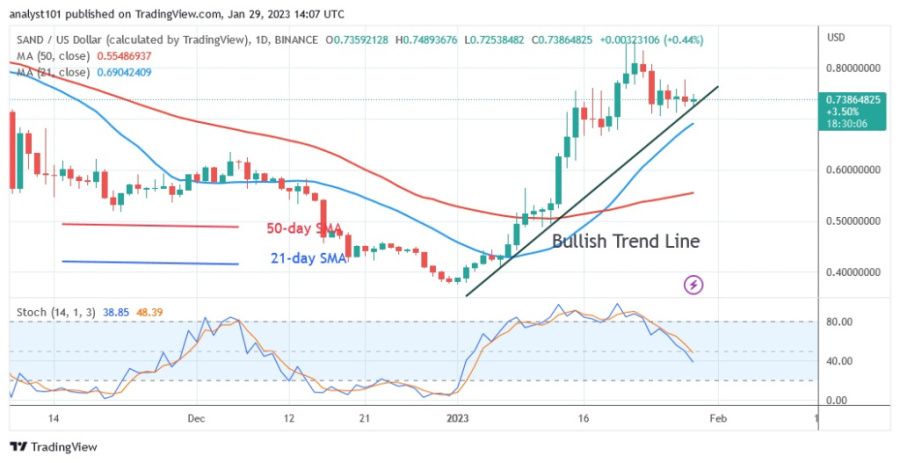
The price of Sandbox (SAND) is rising after reaching a high of $0.80. The uptrend has been broken since January 22, when the price fell back above the $0.71 support and the moving average lines. If the current support holds, the uptrend will resume. The cryptocurrency will rise and reach a new high of $0.97. If the price bars above the moving average lines, the upward movement will start. If the price falls below the moving average lines, the value of the altcoin will decrease. Before that, the altcoin had a bearish momentum below the daily stochastic level of 60. The altcoin performed the fourth worst this week. It has the following characteristics:
Current price: $0.7389
Market capitalization: $2,216,249,574
Trading volume: $162, 859.28
7-day gain/loss %: 8.55%
Zcash
The price of Zcash (ZEC) oscillates between $36 and $48 while moving in a sideways pattern. Since the price decline on November 8, the price range has not been broken. Since December 13, buyers have been desperately trying to break through the resistance at $48. Each time the altcoin falls above or below the moving average lines. As the altcoin approaches the overbought zone today, it could be rejected. However, if the buyers manage to break the current barrier, the market will rise to a high of $58. The Relative Strength Index for the 14 period has the cryptocurrency at level 58, suggesting that the cryptocurrency will go higher in the future. The worst performance of the week was achieved by ZEC. It has the following characteristics:
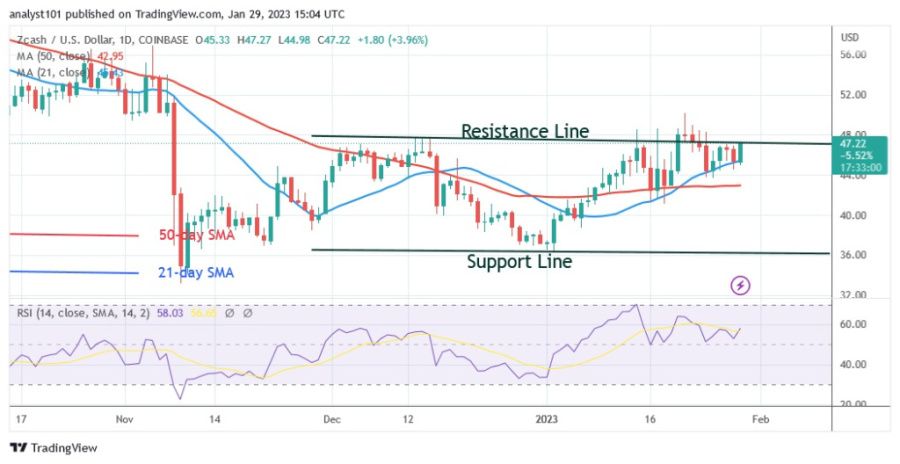
Current price: $47.79
Market capitalization: $1,002,451,401
Trading volume: $66,818,140
7-day gain/loss %: 7.62%
Disclaimer. This analysis and forecast are the personal opinions of the author and are not a recommendation to buy or sell cryptocurrency and should not be viewed as an endorsement by CoinIdol. Readers should do their research before investing in funds.
Price
Price
Price
Price
Price

(0 comments)