Weekly Cryptocurrency Market Analysis: Altcoins Hold Near Overhead Resistance Levels While Cryptocurrencies Continue Sideways Movement
Updated: May 20, 2023 at 13:59

The cryptocurrencies under review are the best performing cryptocurrencies.
Cryptocurrency appear to have reached their bullish limit. In other words, cryptocurrencies are moving sideways after failing to break above resistance levels. So let us take a look at some of these altcoins.
Render Token
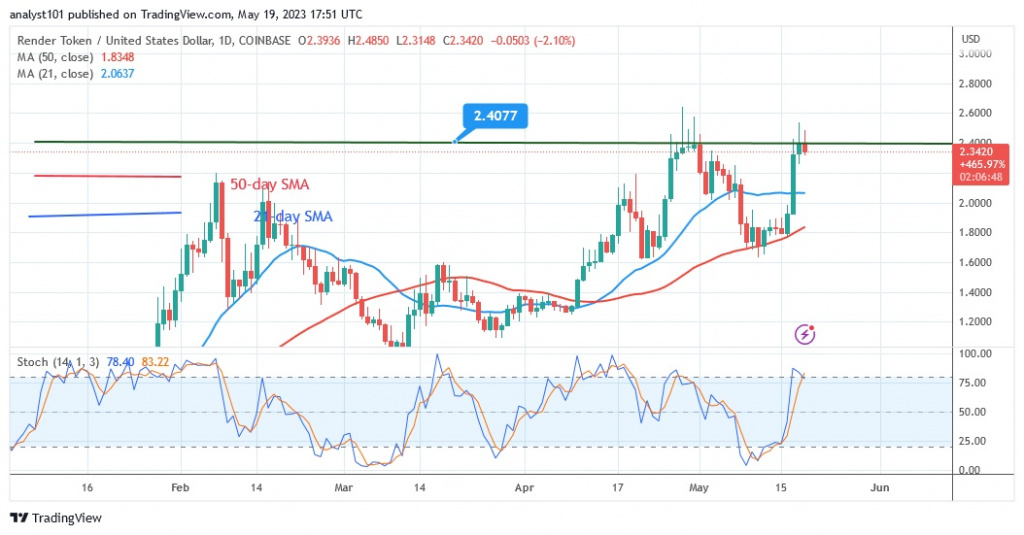
The price of Render Token (RNDR) is correcting upwards as it tries to break the overhead barrier at $2.40. The cryptocurrency asset has been moving sideways since February 7. In order to resume an uptrend, buyers have struggled to break through the overhead resistance. Although the cryptocurrency price broke the barrier twice, the bullish momentum failed to continue. After retesting the overhead barrier, RNDR is currently trading at $2.35. If the overhead resistance is broken, the cryptocurrency will go up to $3.00. The high of $2.40 is currently an overbought area of the market. The best performing cryptocurrency is an altcoin that has reached an overbought condition and is called RNDR. It has these characteristics:
Current price: $2.28
Market capitalization: $1,238,644,861
Trading volume: $1,238,644,861
7-day gain/loss: 34.55%
SingularityNET
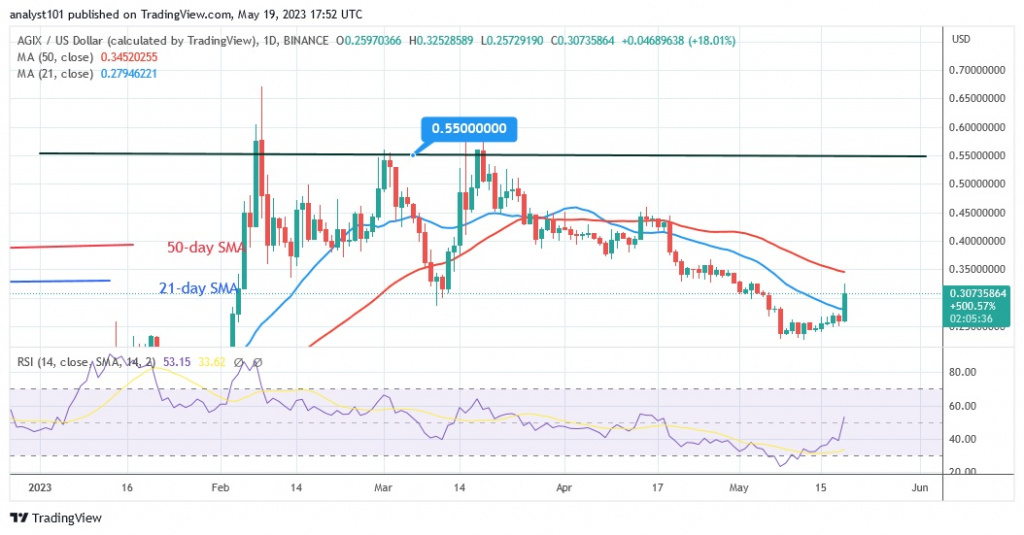
SingularityNet (AGIF) is sinking below its moving average lines. The cryptocurrency asset has broken above the 21-day line SMA and is currently in an upward correction. The altcoin is now between the moving average lines as a result of this price change. On the upside, AGIF will rise and retest the overhead barrier at $0.55 if buyers manage to keep the price above the 50-day line SMA. On February 7, buyers attempted to break the barrier at $0.55 but were rejected. However, after two rejections, buying pressure returned. The altcoin has recovered today, but is trading at $0.30 at the time of writing. The moving average lines are still crossed by the price. If the price of the cryptocurrency does not break the moving average lines, the sideways movement may resume. The Relative Strength Index for the cryptocurrency for the period 14 is 53. AGIF has been the second best performer among cryptocurrencies.
Current price: $0.3035
Market capitalization: $612,142,202
Trading volume: $166,794,626
7-day gain/loss: 27.05%
Conflux
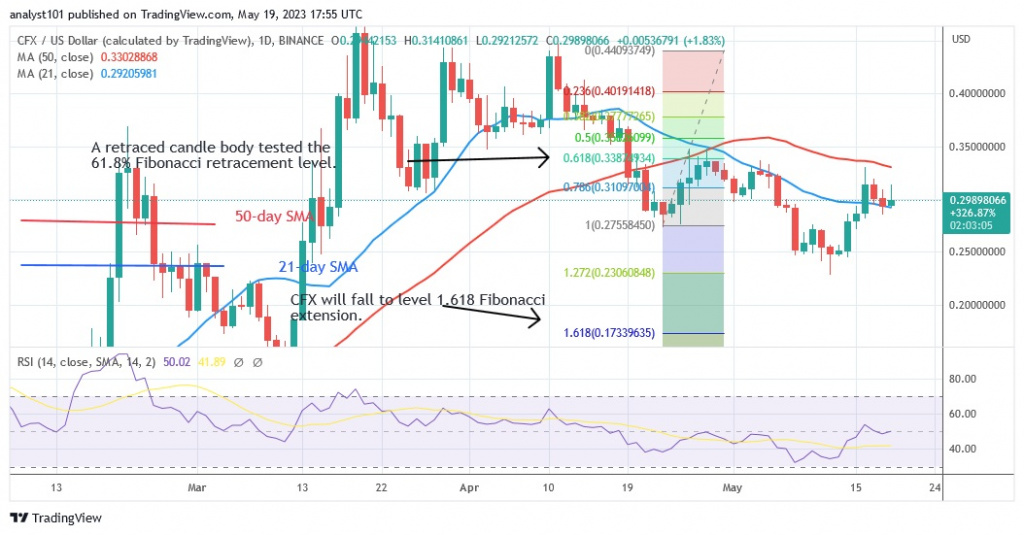
The price of Conflux (CFX) is trending downwards but correcting upwards. Although the price of the cryptocurrency has crossed the 21-day line SMA, it is still wedged between the moving average lines. In the last 48 hours, the bears have tried to get below the 21-day line SMA. The price indicates a further decline in the cryptocurrency. CFX had an upside reversal during the April 23 downturn and a candlestick tested the 61.8% Fibonacci retracement level. After the correction, CFX will fall to the $0.17 level or the 1.618 Fibonacci extension level. For the period 14, the Relative Strength of CFX is at level 49, indicating that the equilibrium between supply and demand has been reached. CFX is the third best performing cryptocurrency. It has the following characteristics:
Current price: $0.2976
Market capitalization: $1,574,487,287
Trading volume: $169,001,796
7-day gain/loss: 25.24%
Mask Network
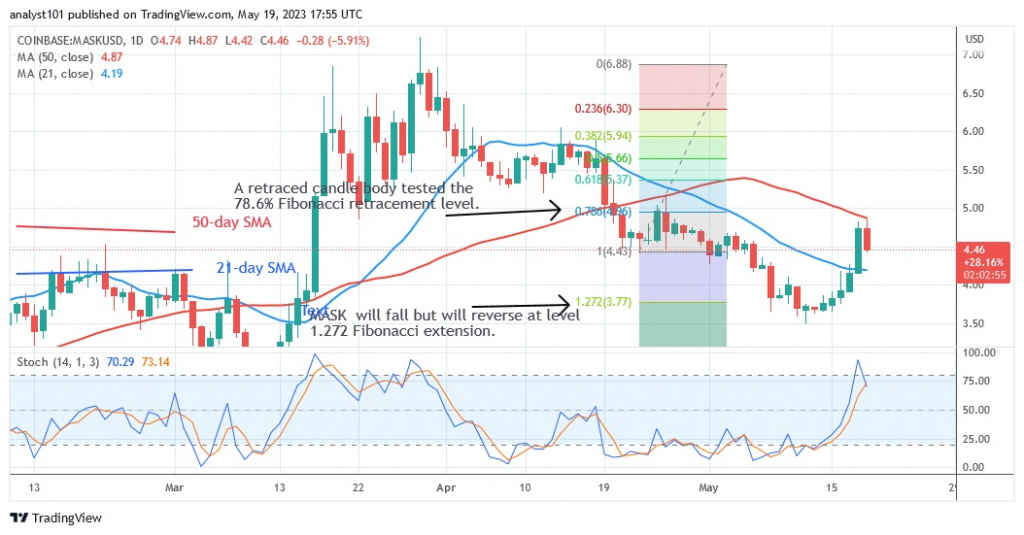
Mask Network (MASK) has made an upward correction to reverse the previous downturn. The cryptocurrency price has broken above the 21-day SMA line, but $5.00 or the 50-day SMA line offer resistance. If MASK had broken through this barrier, the uptrend would have resumed. The previous record high of MASK would have been $7.24. The altcoin is currently trapped within the moving average lines. At this point, the altcoin is trading at $4.46. For a few days, MASK will be forced to move in a range as it is trapped between the moving average lines. Once the moving average lines are broken, the altcoin will start a new trend. MASK has reached the overbought zone of the market. It is below the 80% area of the daily stochastic. If buyers emerge in the overbought zone, MASK is at risk of falling further. MASK is the fourth best performing cryptocurrency. Here are its characteristics.
Current price: $4.49
Market capitalization: $454,637,866
Trading volume: $158,605,187
7-day gain/loss: 24.15%
Injective
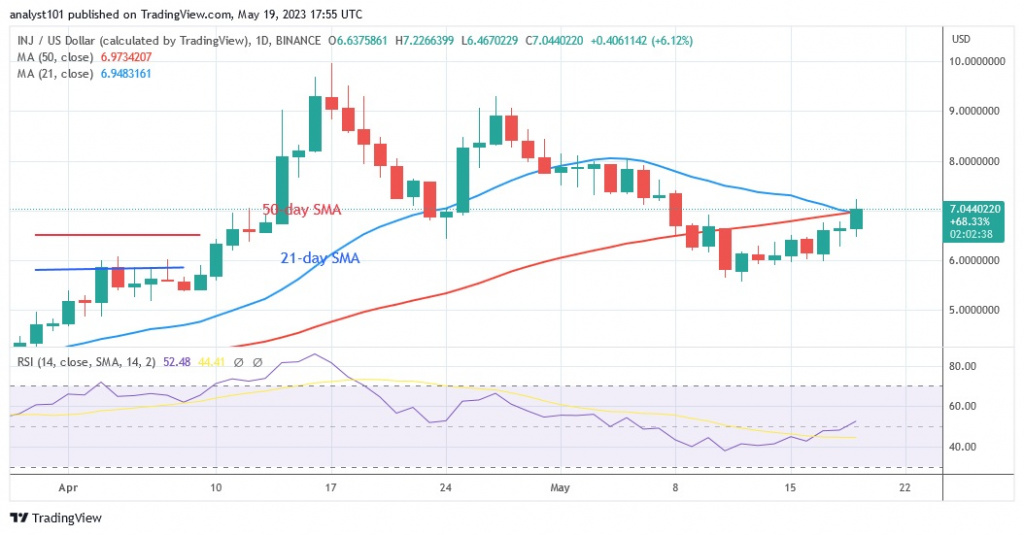
Injective (INJ) has moved sideways but has fallen below its moving average lines. The moving average lines are currently rejecting the upside correction. If buyers are able to keep the price above the moving average lines, INJ will regain its previous high of $9.00. Since April 16, the resistance at $9.00 has not been breached. If the altcoin is rejected at the moving average lines, it will drop and retake its previous low of $6.00. The Relative Strength Index for period 14 shows INJ at the 51 level, indicating that supply and demand are in balance. INJ is the fifth best performing cryptocurrency and has the following characteristics:
Current price: $6.99
Market capitalization: $703,733,853
Trading volume: $90,968,635
7–day gain/loss: 17.33%
Disclaimer. This analysis and forecast are the personal opinions of the author and are not a recommendation to buy or sell cryptocurrency and should not be viewed as an endorsement by CoinIdol. Readers should do their own research before investing in funds.
News
Price
Price
News
Coin expert

(0 comments)