Weekly Cryptocurrency Market Analysis: Altcoins Extend Their Recovery as They Attract Buying at Lower Levels
Updated: Jul 12, 2022 at 13:02

GNT, ICP, and MATIC have been exceptionally positive as cryptocurrencies trade in bullish trend zones. Altcoins are still dealing with selling pressure as they consolidate above moving average lines. AAVE and CRV are fluctuating between the moving average lines as the bulls try to break out to the upside.
Quant
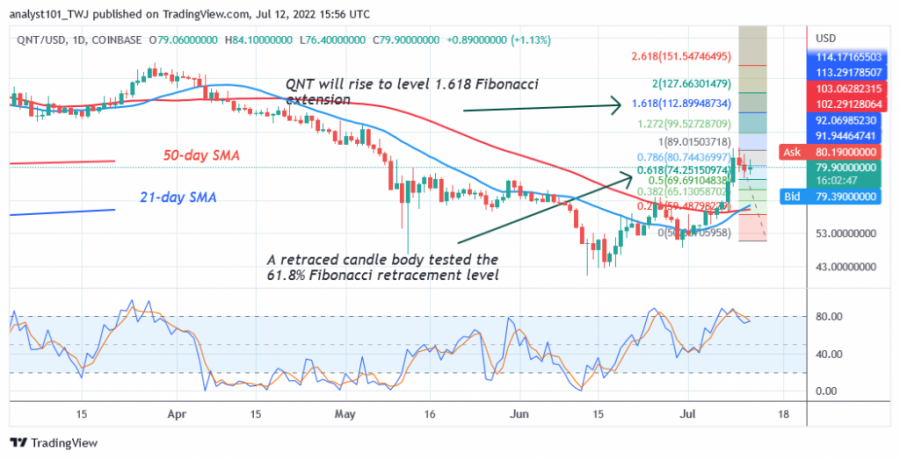
Quant (QNT) is in an uptrend as it has moved positively above the moving average lines. The altcoin rallied to the high of $89.99 and then declined. The uptrend is rejected at $90. QNT has resumed a new uptrend after a minor setback. Meanwhile, the July 9 uptrend has shown a candle body testing the 61.8% Fibonacci retracement level. The retracement suggests that QNT will rise to the 1.618 Fibonacci Extension level or $112.89. It is above the 75% area of the daily stochastics. This indicates that the altcoin is in a bullish momentum. It is the best performing cryptocurrency asset this week. It has the following characteristics:
Price: $80.59
Market capitalization: $1,177,693,719
Trading volume: $70,591,335
7-day gain/loss: 32.33%
Internet Computer
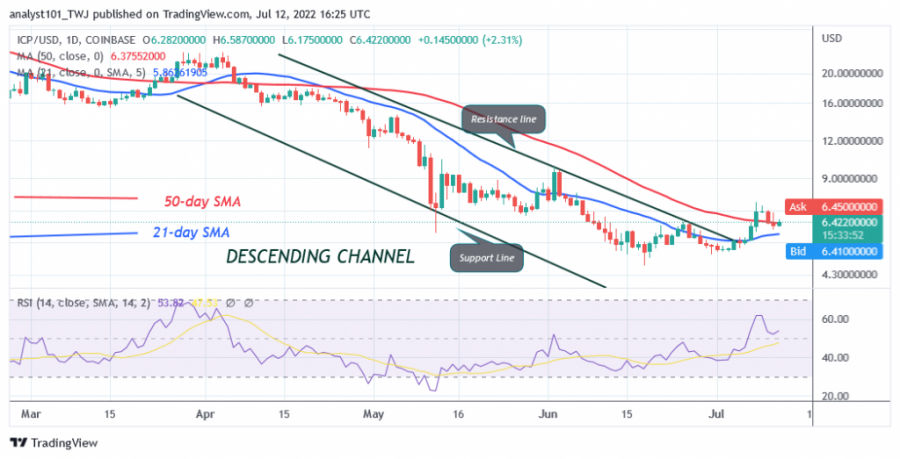
Internet (ICP) is in an uptrend as the price breaks above the moving average lines. The price of the cryptocurrency has pulled back above the 50-day line SMA and started a new uptrend. If the 50-day line SMA holds, ICP will trend upwards and regain the previous highs of $9 and $14. However, if the bears break below the 50-day line SMA, the altcoin will decline and settle between the moving average lines.
ICP is at level 53 of the Relative Strength Index of period 14, indicating that the cryptocurrency asset is in the uptrend zone and capable of further upward movement. However, ICP is the cryptocurrency with the second best performance this week. It has the following characteristics:
Price: $6.43
Market capitalization: $3,088,784,995
Trading Volume: $104,534,718
7-day gain: 14.69%
Polygon
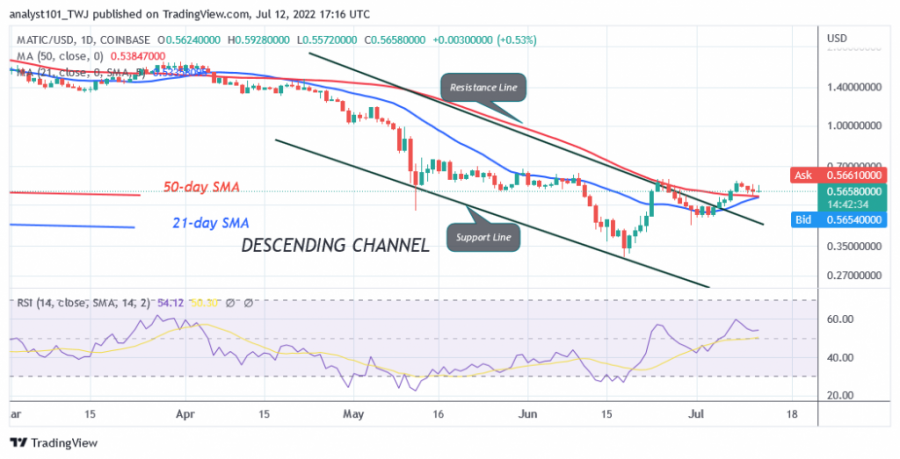
Polygon (MATIC) is performing positively as the price breaks out above the moving average lines. On June 24, the bulls failed to break above the 50-day line SMA as the altcoin fell above the 21-day line SMA. On July 7, the cryptocurrency resumed its uptrend and broke above the 50-day line SMA. If the current uptrend continues, the altcoin will rise to $0.80 and $1.00. However, the upward movement is doubtful as small indecisive doji candlesticks can be seen. These candlesticks represent delays in the price movement.
The altcoin is at level 53 of the Relative Strength Index of period 14, indicating that the cryptocurrency is in the bullish trend zone and could continue to rise. The market is moving back above the moving average lines. The altcoin will resume its downtrend if the bears break below the moving average lines. MATIC is the cryptocurrency with the third best performance this week. It has the following characteristics:
Price: $0.564
Market capitalization: $5,640,417,441
Trading Volume: $700,082,519
7-day gain: 9.22%
Aave
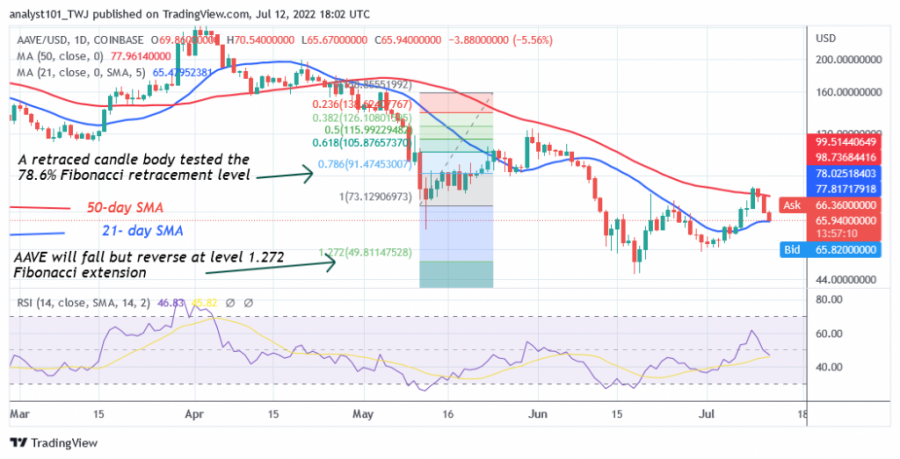
The price of Aave (AAVE) is in an upward correction as it fluctuates between the moving average lines. On July 9, the bulls broke through the moving average lines but failed to break above the 50-day line SMA. Today, the bears are trying to drop below the 21-day line SMA. If the bears break below the 21-day line SMA, the altcoin will fall and continue its downward correction. The cryptocurrency will regain the previous lows of $52 and $45. However, the market will go back up if the current support holds.
AAVE is at level 46 of the Relative Strength Index for period 14, indicating that the coin is in the downtrend zone and could go back. It is the cryptocurrency with the fourth best performance this week. It has the following characteristics:
Price: $66.38
Market capitalization: $1,062,138,288
Trading volume: $211,719,171
7-day gain: 8.36%
Curve DAO Token
Curve DAO Token (CRV) trades between the moving average lines. Bulls broke out above the moving average lines but could not sustain the bullish momentum to the previous highs. CRV has fallen and is fluctuating between the moving average lines. The altcoin will perform when the moving average lines are broken. For example, if the bulls break the 50-day line SMA and the bullish momentum continues, the altcoin will rise to the highs of $1.5 and $2.60. CRV is the cryptocurrency asset with the fifth best performance this week. It has the following characteristics:
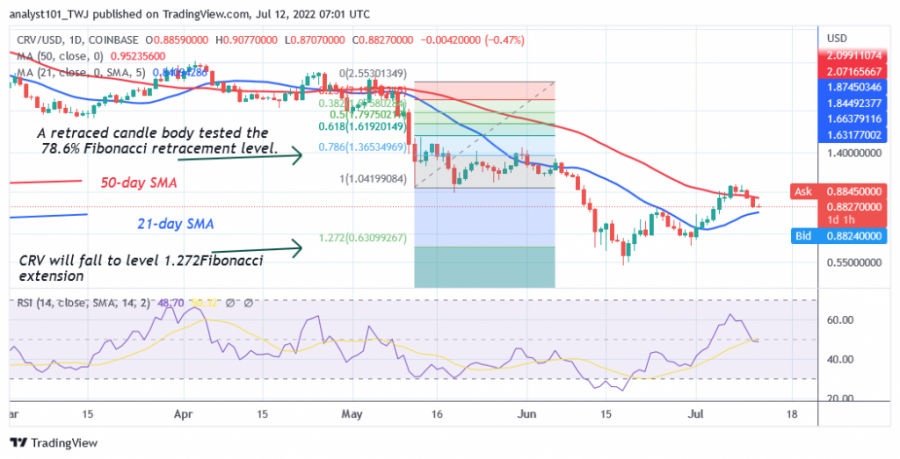
Price: $0.885
Market capitalization: $2,923,260,292
Trading volume: $110,108,053
7-day gain: 4.31%
Disclaimer. This analysis and forecast are the personal opinions of the author and are not a recommendation to buy or sell cryptocurrency and should not be viewed as an endorsement by CoinIdol. Readers should do their own research before investing.
News
Price
Coin expert
Price

(0 comments)