Weekly Cryptocurrency Market Analysis: Altcoins Exhaust Their Bearish Potential While Gaining Traction

Cryptocurrencies are sinking below their moving average lines. Altcoin is at risk of falling further while in the bearish trend zone.
Although Aptos might be experiencing an uptrend, the stock is currently oversold. While falling, the prices of HBAR, QNT, XLM and ZIL are correcting upwards. We will take a closer look at some of these coins.
Hedera
The price of Hedera (HBAR), which was rejected at the high of $0.075, is currently falling. Buyers' attempts to keep the price above the moving average and the $0.075 resistance were unsuccessful. HBAR is no longer above the moving average lines. Selling pressure is likely to intensify once the price falls below the moving average. Doji candlesticks are present, so the recent decline has been minimal. HBAR is trading for $0.065 at the time of writing. The altcoin will fall to its previous low at $0.060 if selling pressure continues. On the other hand, HBAR will move back up if the price rises back above the $0.065 support level. If the bullish momentum exceeds the moving average lines, the uptrend will resume. The value of the altcoin rises above the daily stochastic value of 30. The performance of the altcoin was the worst this week. The cryptocurrency's characteristics include:
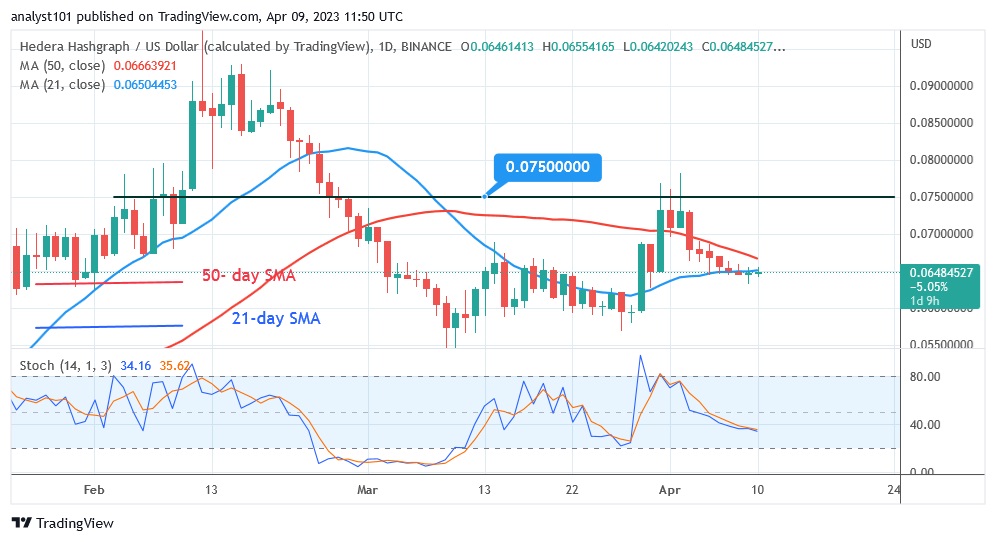
Current price: $0.06499
Market capitalization: $3,248,212,489
Trading volume: $27,313,337
7-day gain/loss: 7.96%
Quant
Quant (QNT) has fallen below the moving average lines. Earlier, buyers tried to keep the price above the moving average lines but were rejected twice at the $132 and $128 resistance levels. The altcoin is in danger of falling to new lows. If the selling pressure continues, the downward momentum will continue to the previous low of $112. The market has now entered oversold territory. As the altcoin has passed its negative peak, it might consolidate and recover. Once the resistance level at $130 is broken and the bullish momentum above the moving average lines continues, the altcoin will resume its upward trend. With a Relative Strength Index reading of 45 for the 14 period, QNT is in a bearish trend zone. The altcoin with the second worst performance among cryptocurrencies has the following characteristics:
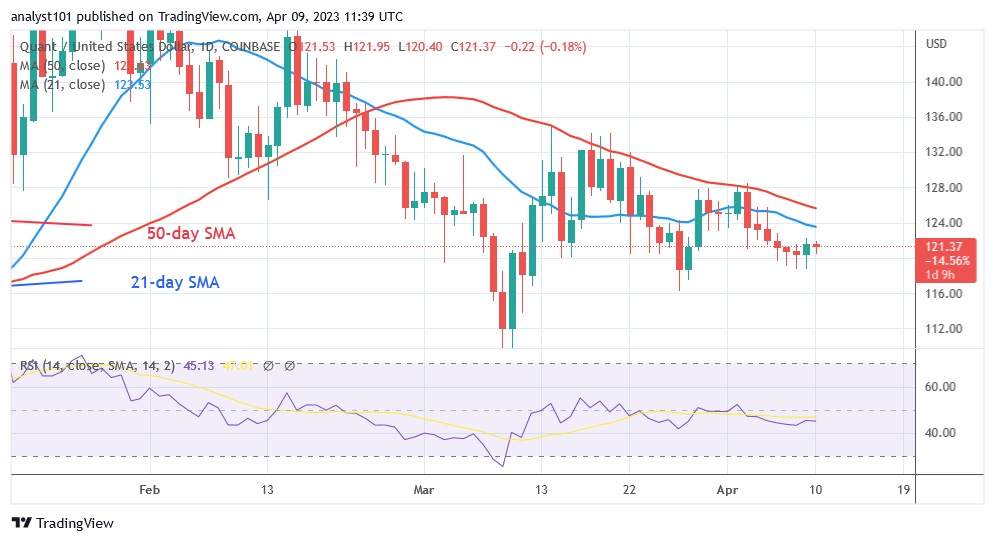
Current price: $120.80
Market capitalization: $1,797,607,152
Trading volume: $12,786,865
7-day gain/loss: 4.42%
Aptos
Aptos (APT) is falling below the moving average lines. Since March 27, APT has been consolidating above $10.85 support following the decline. If the selling pressure continues, the downward momentum will reach the low of $10.00. Further declines in the cryptocurrency's value are unlikely as the market has now entered oversold territory. Moreover, the visible tails of the long candles indicate active buying at lower price levels. The daily stochastic is currently below the 20 level and bearish exhaustion has been reached with the selling pressure. Below is a description of APT, the third worst performing cryptocurrency.
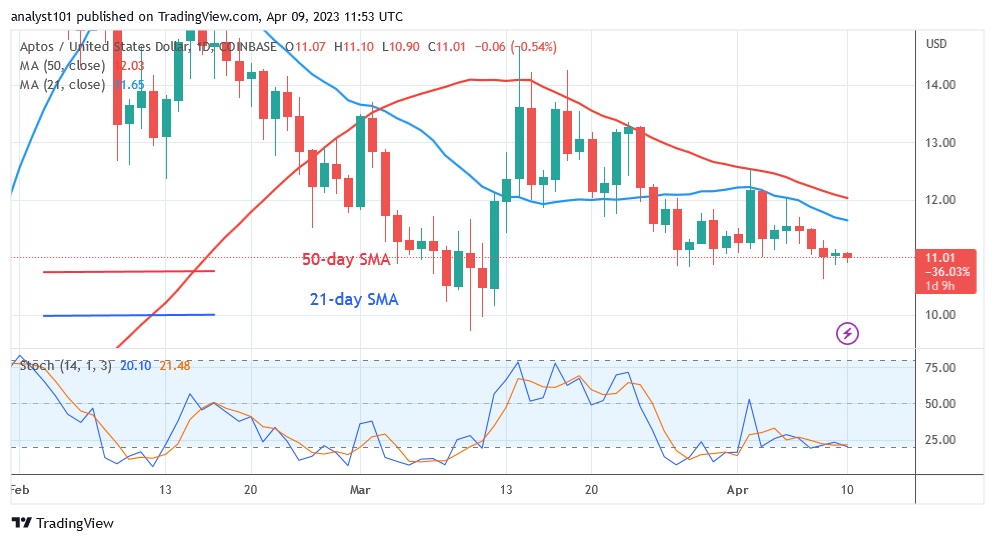
Current price: $11.02
Market capitalization: $11.326.210.584
Trading volume: $103,638,147
7-day gain/loss: 4.05%
Stellar
Stellar (XLM) is currently in a small retracement following a bullish uptrend. The uptrend could continue if the price rises back above the moving average lines or the $0.10 support. At the time of writing, the cryptocurrency is trading at $0.103. On the plus side, Stellar will rise to highs of $0.12 and $0.14 if it rallies above the current support. On the downside, the altcoin will fall to a low of $0.090 if the price drops below the 21-day line SMA. XLM is trending down below the daily stochastic level of 60. It is currently the fourth worst cryptocurrency this week. It has the following characteristics:
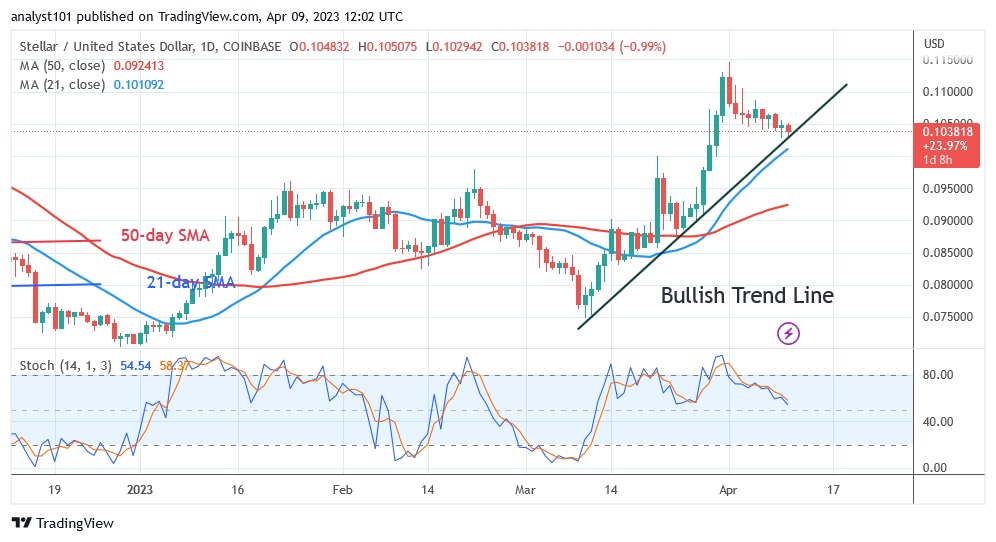
Current price: $0.1037
Market capitalization: $5,184,123,819
Trading volume: $38,934,876
7-day gain/loss: 3.91%
Zilliqa
Zilliqa (ZIL) is in a decline between the moving average lines. Previously, the price of the cryptocurrency was rising. When the alternative currency reached $0.032, it declined. ZIL is currently trading for $0.028. The altcoin is currently contained between the moving average lines. If the moving average lines are broken, ZIL will develop a trend. The uptrend will continue if the price climbs back above the 50-day line SMA. Likewise, if the price falls below the 21-day line SMA, a further decline can be expected. On the Relative Strength Index for the period 14, ZIL is at level 49. The price of the altcoin has reached its equilibrium level as supply and demand are balanced. It is currently the fifth worst cryptocurrency this week.
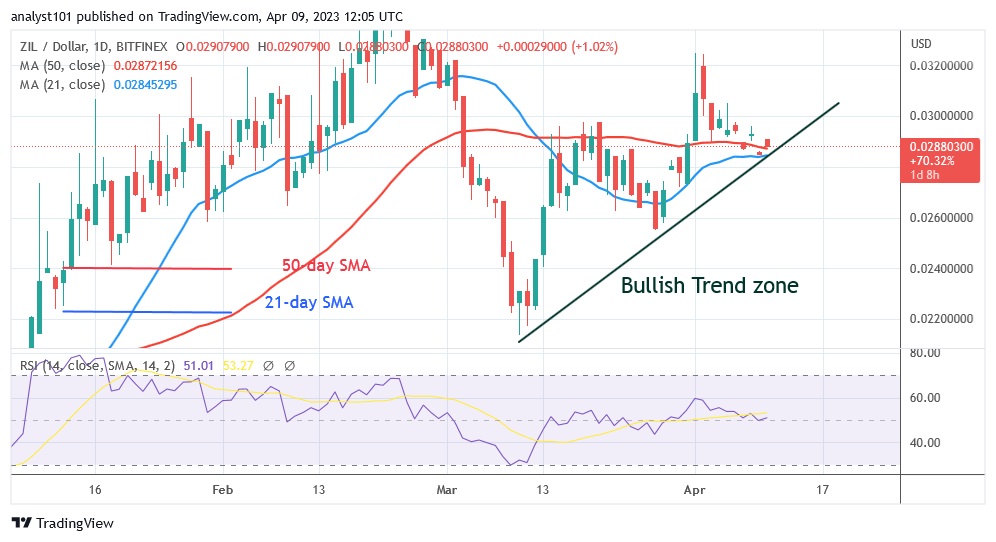
Current price: $0.02879
Market capitalization: $604,474,777
Trading volume: $23,506,136
7-day gain/loss: 3.85%
Disclaimer. This analysis and forecast are the personal opinions of the author and are not a recommendation to buy or sell cryptocurrency and should not be viewed as an endorsement by CoinIdol. Readers should do their own research before investing in funds.
Coin expert
News
Coin expert
Price
Price

(0 comments)