Weekly Cryptocurrency Market Analysis: Altcoins Continue To Fall As Recovery Approaches

The altcoins with the worst weekly performance are the cryptocurrencies analyzed.
Altcoins are trading in the declining trend zone. In some cases, the crypto assets have reached both the oversold and the downtrend zone of the chart. In the downtrend zone, cryptocurrencies are vulnerable to further depreciation. Let us take a look at each of these cryptos individually.
Pepe
Pepe (PEPE) is trapped between the moving average lines and is in a downtrend. The initial slide of the crypto reached a low of $0.0000010000 before experiencing an upward correction. On May 13, the cryptocurrency's price broke above the 21-day line SMA, but remained trapped between the moving average lines. PEPE has settled between the moving average lines in the last 48 hours. The price of the altcoin at the time of writing is $0.0000016994. Breaking through the moving average lines will cause the coin to trend up. The altcoin is currently stabilizing above the 21-day line SMA. Whenever the 21-day line SMA is crossed, PEPE will fall. The altcoin is bouncing between the moving average lines in the meantime. Below the daily stochastic threshold of 40, PEPE is experiencing bearish momentum. The cryptocurrency PEPE has the worst performance and the following characteristics:
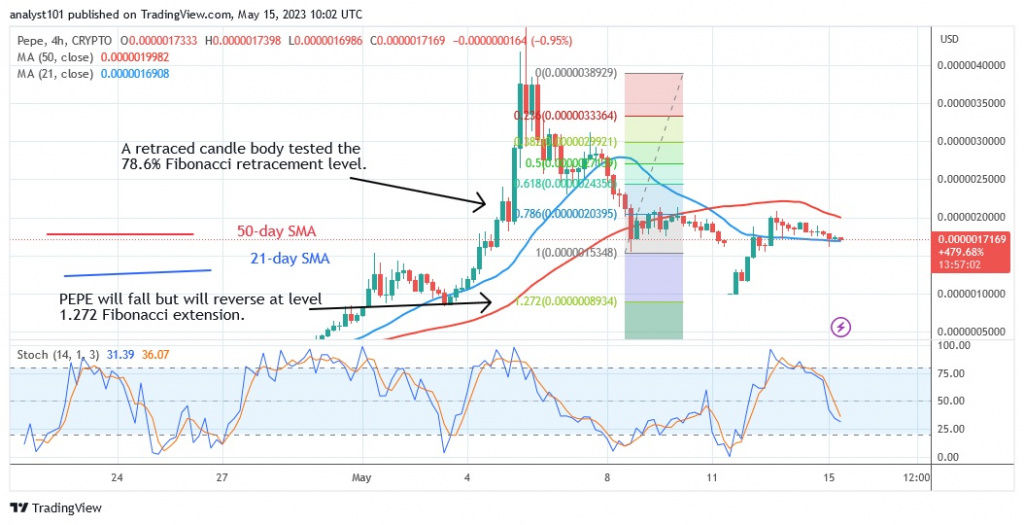
Current price: $0.000001715
Market capitalization: $725,372,584
Trading volume: $423,562,970
7-day gain/loss: 20.88%
Klaytn
The price of Klaytn (KLAY) is in a downtrend and has dropped drastically to the bottom of the chart. The cryptocurrency asset was previously moving sideways as buyers repeatedly tried to keep the price above $0.28, but failed. The current price of Klaytn is at $0.17, having deviated below the moving average lines. KLAY will continue to lose value as it approaches the lowest price point, which is $0.14. Moreover, the oversold zone of the cryptocurrency market has been reached. As the market approaches the oversold area, additional selling pressure is unlikely. The cryptocurrency is below the daily stochastic level of 20. The altcoin KLAY is performing poorly this week and is heavily oversold. It exhibits the following characteristics: It has the following characteristics:
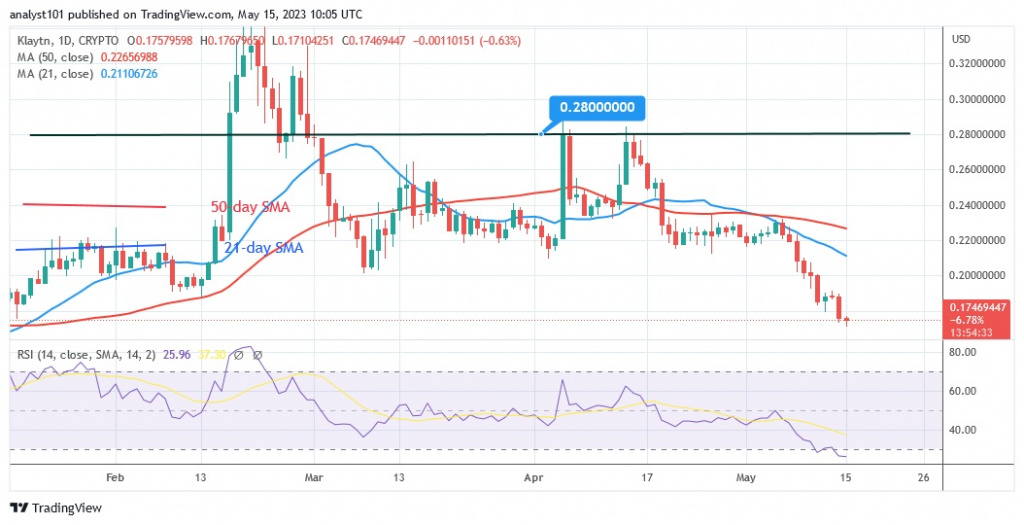
Current price: $0.174
Market capitalization: $1,000,122,349
Trading volume: $35,080,950
7-day gain/loss: 18.53%
Stacks
The price of Stacks (STX) is falling below the moving average lines. The price indicator suggests that the cryptocurrency will continue to trend downwards. STX had an upward correction during the decline on April 7, and a candlestick tested the 61.8% Fibonacci retracement level. After the correction, STX will fall to the 1.618 Fibonacci extension level or $0.50. After the price movement, the market has fallen to a low of $0.63. STX is now trading in the oversold zone of the market. The third worst cryptocurrency is STX. It has these characteristics:
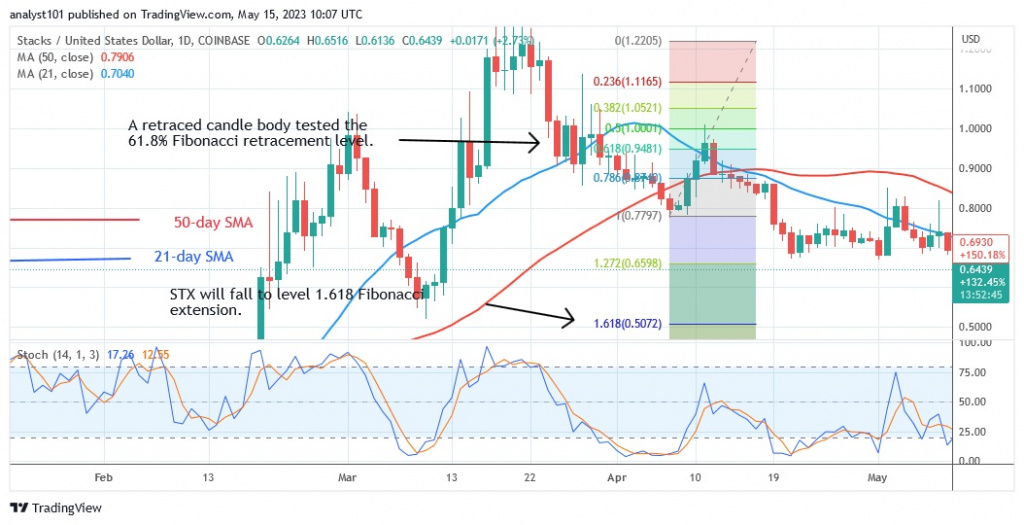
Current price: $0.6382
Market capitalization: $1,162,612,434
Trading volume: $44,934,338
7-day gain/loss: 15.42%
Injective
The price of Injective (INJ) is drifting sideways, but has fallen below the moving average lines. The cryptocurrency asset was on the rise earlier, but it ended at the high of $0.036. Buyers desperately tried to continue the upswing, but they were once again beaten back by the overriding resistance. Bears built up selling pressure again after the break below the moving averages. At the time of writing, INJ is currently trading at $6.33. In the downtrend zone, the altcoin is expected to fall further. On the Relative Strength Index, Injective is at level 44. It is currently the fourth worst cryptocurrency. It has the following characteristics:
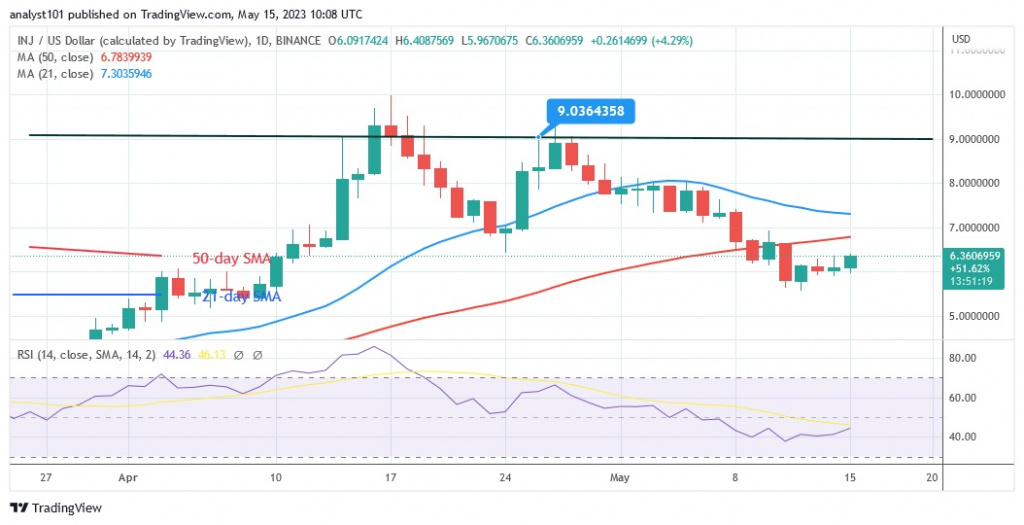
Current price: $6.4122
Market capitalization: $641,522,555
Trading volume: $51,309,535
7-day gain/loss: 8.59%
Maker
The price of Maker (MKR) is down and below the moving average lines. The selling of Maker started on May 5 when buyers were unable to keep the price above the $725 resistance level. Once the price fell below the moving average lines, selling pressure intensified. MKR showed an upward correction during the decline on April 21, and a candlestick tested the 61.8% Fibonacci retracement level. After the correction, MKR will fall to the Fibonacci extension level of $1.618 or $587.32. According to the price movement, the altcoin fell to a low of $636. The oversold area of the market was also reached by the altcoin. The daily stochastic is currently below the level of 20. The altcoin with the following characteristics is the cryptocurrency with the fifth worst performance:
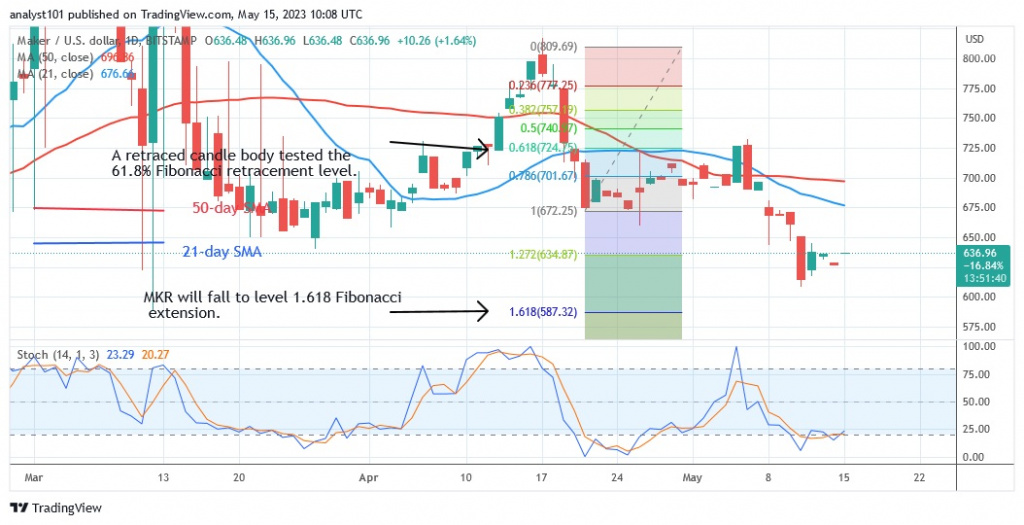
Current price: $638.27
Market capitalization: $641,832,600
Trading volume: $16,329,280
7-day gain/loss: 6.20%
Disclaimer. This analysis and forecast are the personal opinions of the author and are not a recommendation to buy or sell cryptocurrency and should not be viewed as an endorsement by CoinIdol. Readers should do their research before investing in funds.
Price
News
Price
Price
Price

(0 comments)