Weekly Cryptocurrency Market Analysis: Altcoins Rise Back As Bullish Momentum
Updated: Jan 05, 2023 at 14:16

Cryptocurrencies have developed bullish momentum after breaking above the moving average lines.
The problem with cryptocurrencies is that altcoins have entered overbought areas of the market. As sellers emerge in the overbought area of the market, selling pressure has resumed. Let us take a closer look at each of these cryptocurrencies.
Lido DAO
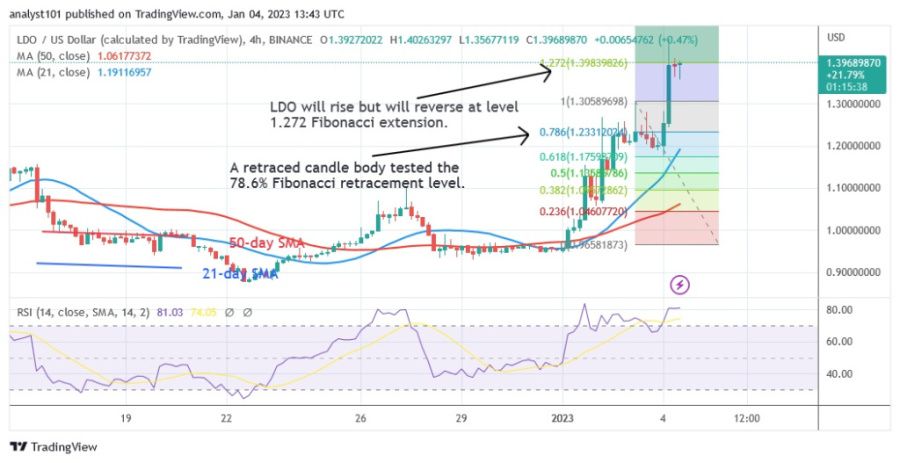
Lido DAO (LDO) has regained upward momentum after breaking above the moving average lines. At $1.45, the cryptocurrency has risen into an overbought area. The altcoin has risen and reached bullish exhaustion, as shown by the price indicator. For example, during the uptrend on January 3, the 78.6% Fibonacci retracement level was tested by the body of a retraced candle. According to the retracement, LDO will rise but reverse at the Fibonacci extension level of $1.272 and $1.39, respectively. The market reportedly peaked at $1.45 but has since fallen below the Fibonacci level due to price action. The relative strength index for period 14 has the cryptocurrency at level 80. The market has reached the overbought zone. If sellers appear in the overbought zone, LDO will fall. It is the cryptocurrency that has performed the best this week due to these characteristics.
Current price: $1.39
Market capitalization: $1,390,627,709
Trading volume: $83,621,709
7-day gain/loss: 46.14%
BitDAO
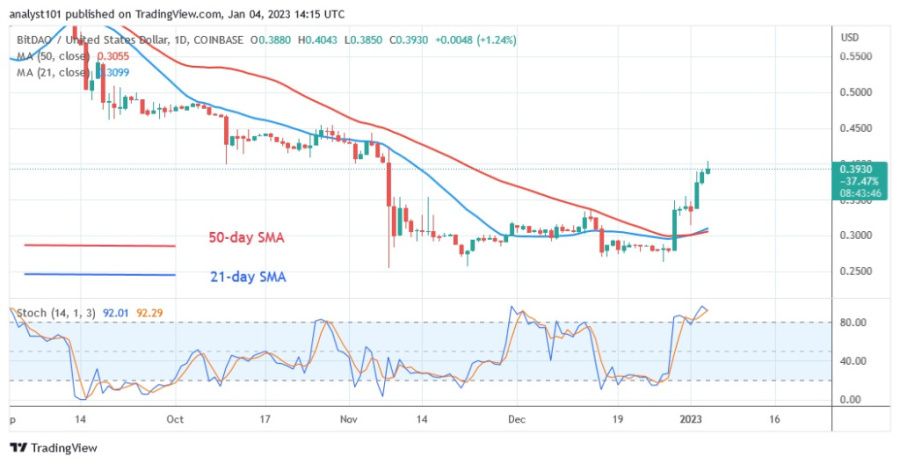
Although BitDAO (BIT) is currently declining, the bullish momentum has returned. The price of the cryptocurrency has risen back above $0.27 and has crossed the moving average. The current support is still within the downtrend zone from November 8. BIT has pulled back above the level of the recent support. Doji candlesticks have resulted in the price movement remaining unchanged. The altcoin recovered and crossed the moving average lines on December 29. The bullish momentum has increased to a high of $0.40 today. BIT is currently above the Stochastic daily value of 80. The market for the altcoin is now overbought. The bullish exhaustion of the recent uptrend has been reached. The cryptocurrency may experience a decline. It has the following characteristics and is the second best performing cryptocurrency:
Current price: $0.3972
Market capitalization: $3,978,372,430
Trading volume: $23,238,893
7-day gain/loss: 42.12%
Solana
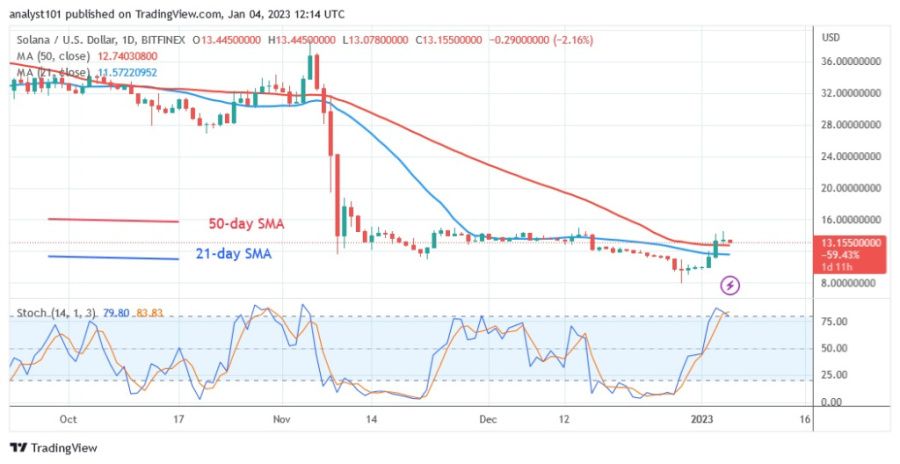
Solana (SOL) has been fluctuating at the bottom of the chart since November 9. The altcoin recovered and crossed the moving average lines on January 2. Solana rose to a high of $14.48, but is rejected at the current level. The $15 resistance area is proving difficult for the altcoin to penetrate. If the altcoin finds support above the moving average lines and the initial resistance level is broken, the current upward momentum will continue. The market will continue to rise and reach a high of $36. On the other hand, the altcoin will return to its previous low of $9.41 if the bears break below the moving average lines. SOL is trading above the daily Stochastic level of 80. Moreover, this shows that the altcoin is currently trading in an overbought area of the market. In the overbought area of the market, Solana is at risk of a decline. Currently the third best performing cryptocurrency, Solana has the characteristics listed below:
Current price: $13.28
Market capitalization: $7,097,005,187
Trading volume: $1,032,419,984
7-day gain/loss: 34.43%
Aptos
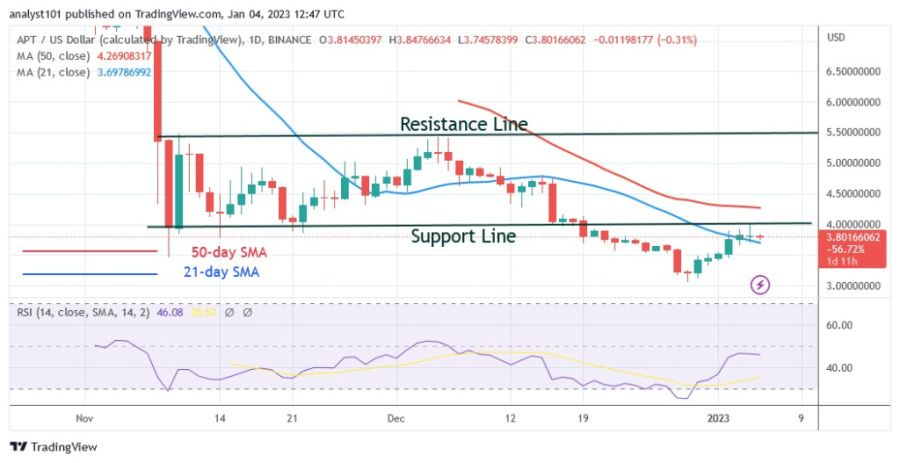
The price of Aptos (APT) has fallen below the moving average lines and is currently in a downtrend. Bearish momentum has reached the previous low at the bottom of the chart. The altcoin is now correcting upwards after falling to a low of $3.16. The price of the cryptocurrency rose above the 21-day moving average line, but $4.00 proved to be a barrier. If the resistance level is broken, the uptrend will continue. The market will rise and eventually reach its previous high of $5.50. If the cryptocurrency fails to break the resistance level, it will move sideways between the moving average lines. However, if the price of the cryptocurrency falls below the 21-day line SMA, APT will fall and retest its previous low of $3.16. Aptos has reached the oversold area at level 45 of the Relative Strength Index for the period 14. It is currently the fourth best performing cryptocurrency this week. It has the following characteristics:
Current price: $3.79
Market capitalization: $3,783,974,565
Trading volume: $134,406,743
7-day gain/loss: 20.58%
OKB
The price of OKB (OKB) is rising as it trades above the moving average lines. OKB's share price rose to a high of $31.26 on January 2. As the market entered an overbought area, the uptrend could not continue. The OKB has been declining since January 3 as sellers enter the overbought area of the market. At the time of writing, the cryptocurrency has hit a low of $27.11. If the price rises back above the moving average lines, the uptrend will resume. On the other hand, if the price breaks below the moving average lines, the uptrend will be terminated. Below the stochastic value of 80 on the daily basis, OKB is in a bearish momentum. OKB is the fifth best performing cryptocurrency. It has the following characteristics:
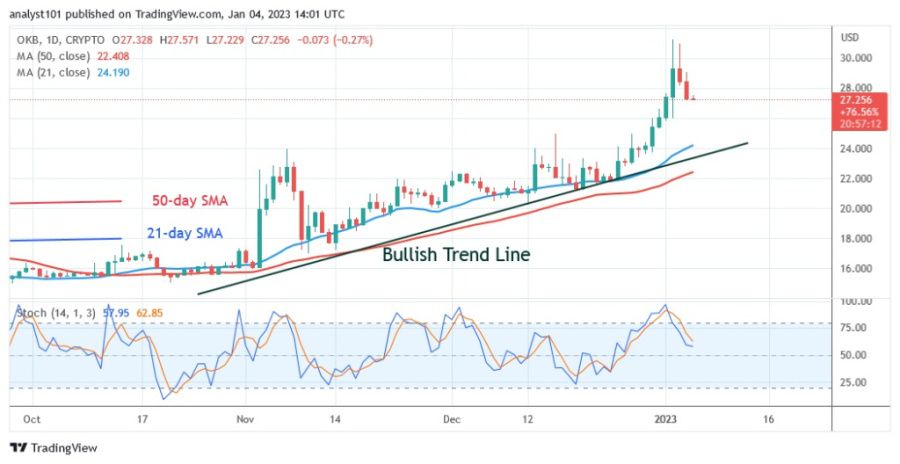
Current price: $27.30
Market capitalization: $8,202,205,159
Trading volume: $8,202,205,159
7–day gain/loss: 18.56%
Disclaimer. This analysis and forecast are the personal opinions of the author and are not a recommendation to buy or sell cryptocurrency and should not be viewed as an endorsement by CoinIdol. Readers should do their research before investing in funds.
Price
Price
Price
Price
Price

(0 comments)