Ripple Faces Strong Rejection at $2.0 Resistance Zone as Ripple Slumps
Updated: Apr 16, 2021 at 12:27

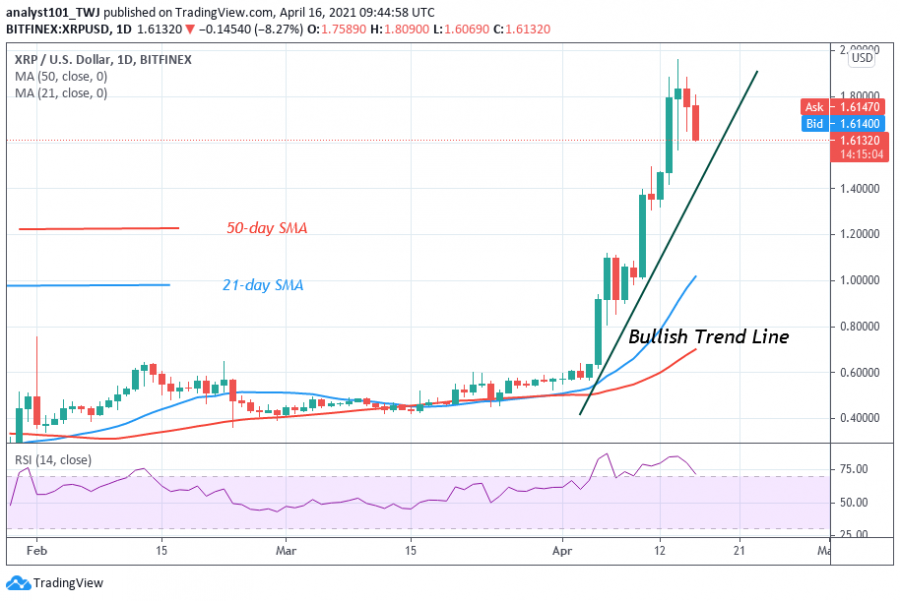
Ripple made an impressive run as XRP reached a peak price of $1.95 about 48 hours ago. On the same date, sellers pushed the XRP price to the low of $1.57.
Ripple (XRP) Price Long-Term Forecast: Bullish
As bulls buy the dips, the upward correction was terminated at the $1.85 high. XRP fell as bulls made another attempt at the recent high. On April 15, the altcoin faced another rejection which made Ripple continue the downward move. Today, the market is on a daily decline as it approaches the previous low at $1.57.
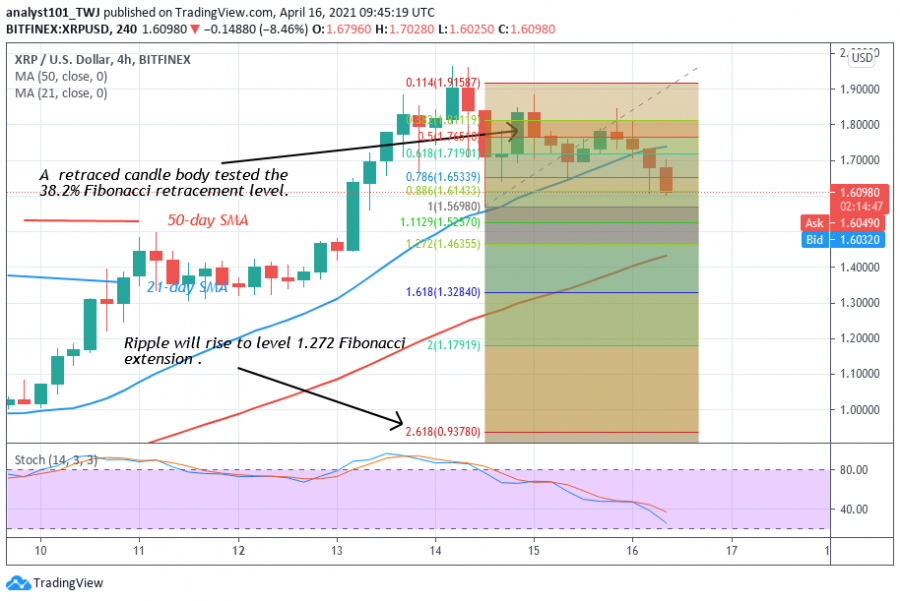
XRP will drop to $0.93 low if the bears break the current support level. Nevertheless, if the support holds, the altcoin will resume a range-bound move between $1.57 and $1.85. XRP/USD is trading at $1.62 at the time of writing. However, further selling pressure is likely if the current support is breached.
Ripple (XRP) Indicator Analysis
XRP price is retracing and approaching the bullish trend line. When price breaks and closes below the trend line, it is assumed that the previous trend has been terminated. In other words, the bears will take control of prices. The altcoin has fallen to level 72 of the Relative Strength Index period 14. XRP price is still in the overbought region of the market. Sellers' presence is unavoidable in the overbought region.

Technical indicators:
Major Resistance Levels – $1.95 and $2.0
Major Support Levels – $0.60 and $0.55
What Is the Next Move for Ripple (XRP)?
Ripple is retracing after the recent rejection at $1.95. The Fibonacci has indicated a downward movement of price. On April 14 downtrend; a retraced candle body tested the 38.2% Fibonacci retracement level. This retracement gives the impression that XRP will fall to level 2.618 Fibonacci extensions or the low of $0.93.

Disclaimer. This analysis and forecast are the personal opinions of the author and not a recommendation to buy or sell cryptocurrency and should not be viewed as an endorsement by CoinIdol. Readers should do their own research before investing
Price
News
Price
Price
Price

(0 comments)