XRP Price Continues Its Range And Struggles With Resistance

The price of the Ripple coin (XRP) has dropped below the moving average lines.
XRP long-term analysis: bearish
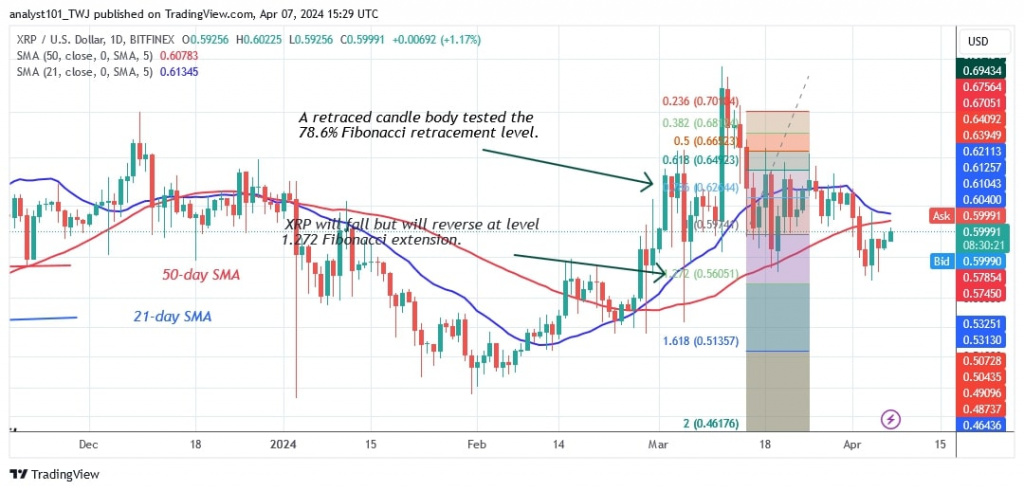
The decline has reached bearish exhaustion. According to the price forecast, XRP will decline but then reverse at the 1.272 Fibonacci extension or $0.5605. Based on price activity, the market reached a low of $0.5623 before recovering. XRP is rising as it approaches the moving average lines. XRP's uptrend will continue if it rises above the moving average lines or the $0.64 level.
The positive trend will continue to the high of $0.74. If the bullish scenario fails, XRP will fluctuate above the $0.56 support and below the moving average lines. The altcoin is currently worth $0.60.
XRP indicator analysis
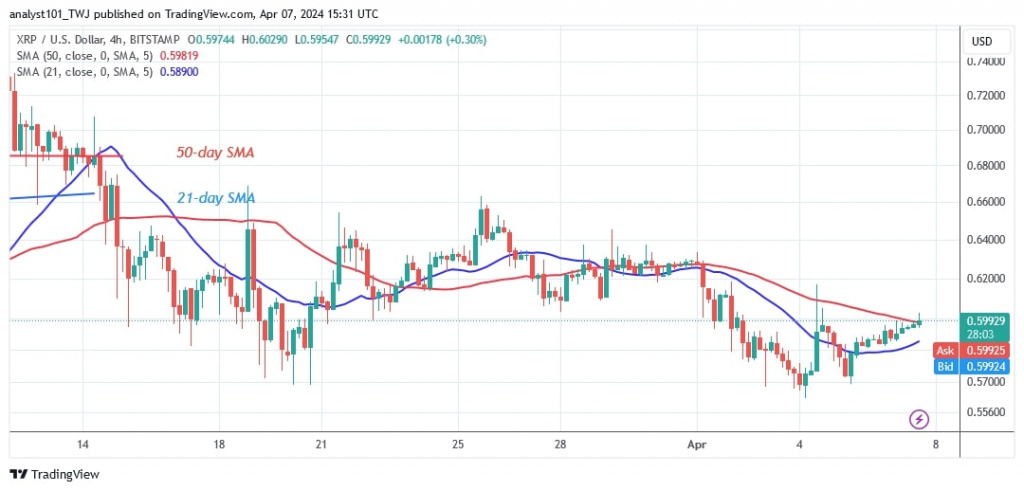
The price bars of the cryptocurrency are below the moving average lines and the altcoin has fallen to the predicted price level. Currently, the altcoin is correcting upwards near the moving average lines. On the 4-hour chart, XRP has corrected upwards and is trapped between the moving average lines. The altcoin will be forced to move in a range between the moving average lines.
Technical indicators:
Key resistance levels – $0.80 and $1.00
Key support levels – $0.40 and $0.20

What is the next direction for XRP?
After the recent dip, the cryptocurrency is correcting upwards. On the 4-hour chart, the price of the cryptocurrency has risen above the moving average lines. The uptrend will continue if the price breaks the moving average lines and closes above them. However, the uptrend is hitting a first resistance at $0.60.

Disclaimer. This analysis and forecast are the personal opinions of the author and are not a recommendation to buy or sell cryptocurrency and should not be viewed as an endorsement by CoinIdol.com. Readers should do their research before investing in funds.
Price
News
Price
Price
Price

(0 comments)