XRP Holds Solidly Above $0.51 And Moves Moderately

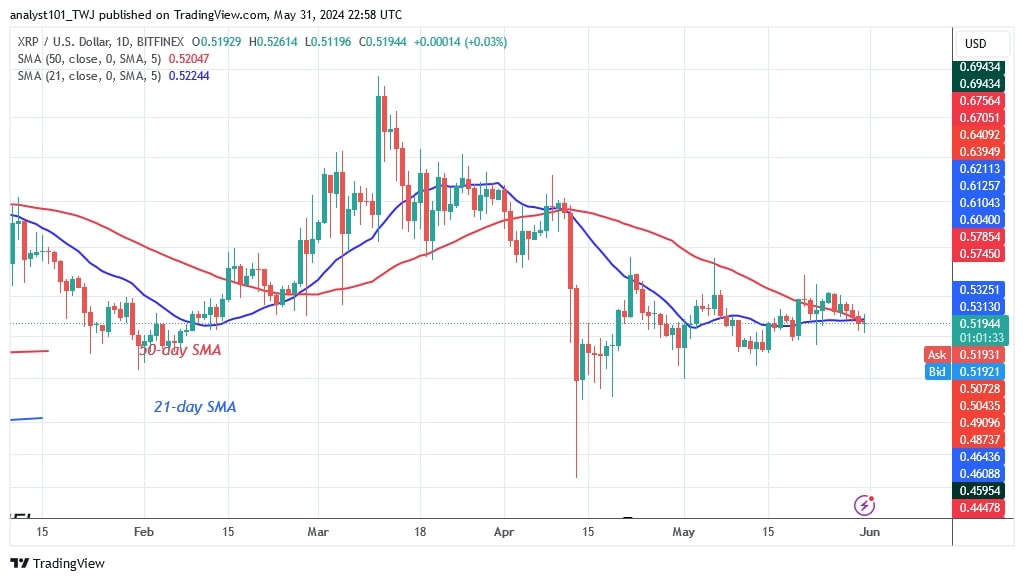
The XRP (XRP) price is trading just below the moving average lines. Price analysis by Coinidol.com.
XRP long-term analysis: fluctuating
Price action, indicated by small, uncertain candlesticks, has remained immobile. Traders are undecided about the direction of the market. The price has not changed in the last three days. The price of the cryptocurrency has fallen below the moving average lines, giving the bears an advantage. If the altcoin is rejected at the moving average lines, it will drop lower and retest its current support of $0.48. In the meantime, XRP is trading in the bearish trend zone.
XRP indicator analysis
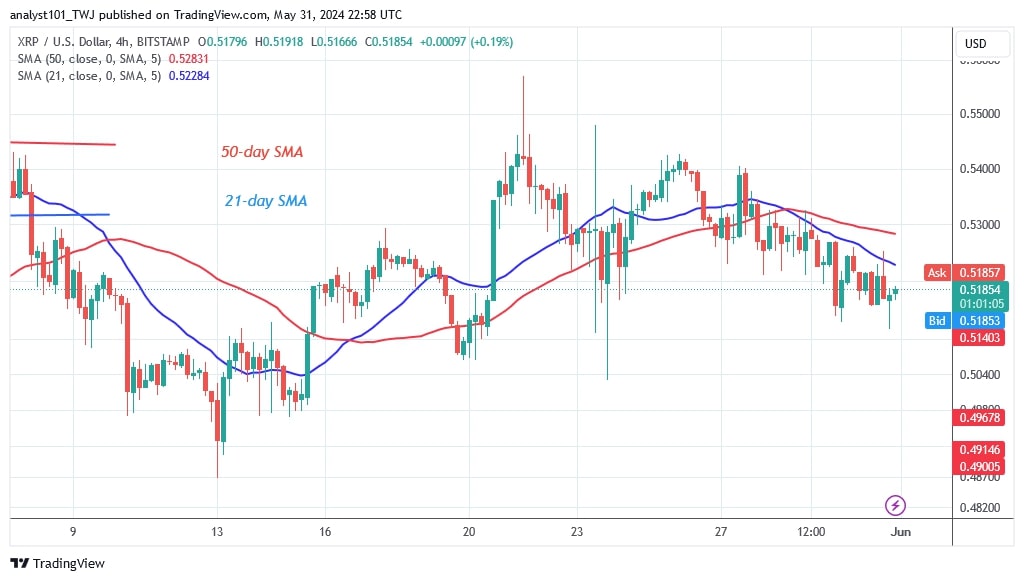
XRP price bars have fallen below the moving average lines. The moving average lines are horizontal. The price bars have retraced below the moving average lines, indicating a possible decline. However, doji candlesticks have slowed down the price movement of the cryptocurrency.
Technical indicators:
Key resistance levels – $0.80 and $1.00
Key support levels – $0.40 and $0.20

What is the next direction for XRP?
The cryptocurrency is falling below the moving average lines. The price of the cryptocurrency has been holding steady above the support level of $0.51 for the past three days. The extended candle tails at the bottom of the chart indicate strong buying pressure.

Disclaimer. This analysis and forecast are the personal opinions of the author and are not a recommendation to buy or sell cryptocurrency and should not be viewed as an endorsement by CoinIdol.com. Readers should do their research before investing in funds.
Price
Price
News
Price
Price

(0 comments)