XRP Continues Its Range And Challenges Resistance At $0.64

The coin Ripple (XRP) falls below the moving average lines. Ripple coin price analysis by Coinidol.com.
XRP price long-term forecast: bearish
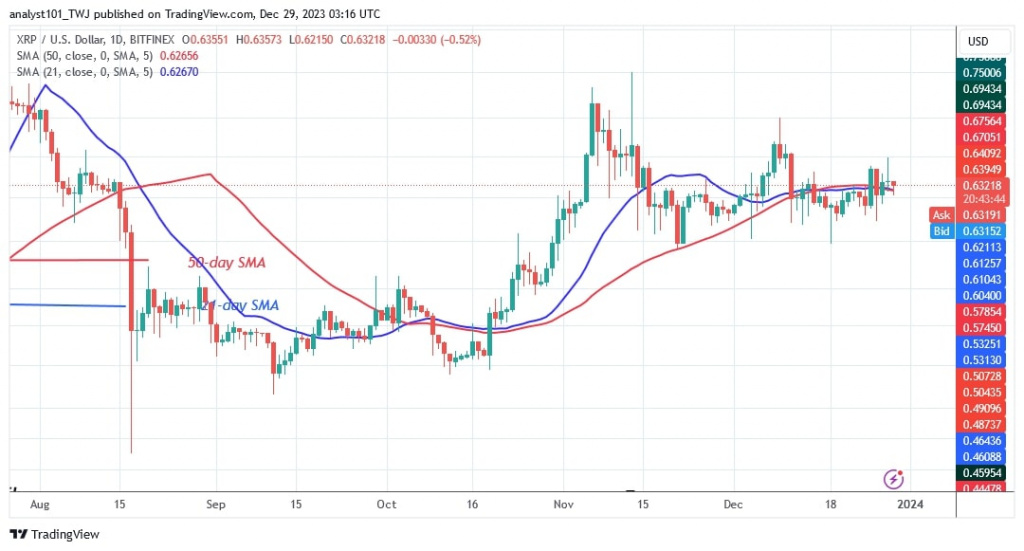
The Ripple (XRP) coin has been trading in a range since the end of the rally on November 6. The price movement was halted by the presence of doji candlesticks.
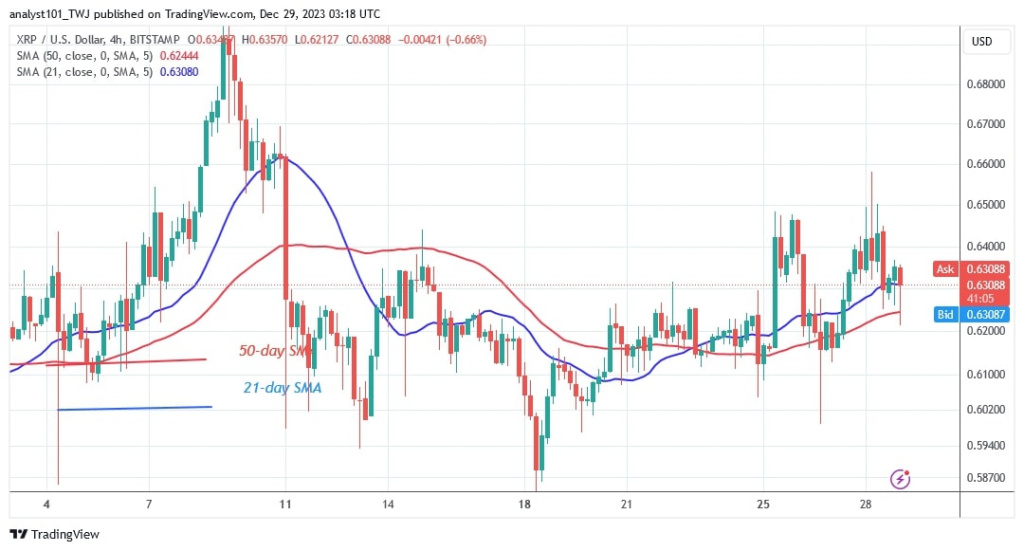
On December 25, buyers tried to hold the price above the moving average lines but were rejected. XRP is now valued at $0.62 after falling below the moving average lines. The bearish momentum of the bears will reach a low of $0.60 if they manage to break below the moving average lines. The uptrend is slowed by the rejection on December 28. On December 28, the candle has a long wick. The candle wick indicates significant selling pressure at higher price levels. The negative momentum will continue to the $0.60 floor if the bears break below the moving average lines.
XRP indicator analysis
The cryptocurrency value has fallen below the moving average lines, adding to the selling pressure. In addition, the price bars are slipping below the horizontal moving average lines. Doji candlesticks, which dictate the price movement, are also included in the price action.
Technical indicators:
Key resistance levels – $0.80 and $1.00
Key support levels – $0.40 and $0.20

What is the next move for XRP?
Cryptocurrency price falls below moving average lines. Candlesticks with long tails indicate the bearish trend zone. Long candlestick tails signal that strong buying is taking place at lower price levels. On the downside, the bulls have successfully defended the current support level of $0.60.
A week ago Coinidol.com reported that Ripple coin was rejected twice at highs of $0.69 and $0.64 before falling into the downtrend zone.

Disclaimer. This analysis and forecast are the personal opinions of the author and are not a recommendation to buy or sell cryptocurrency and should not be viewed as an endorsement by CoinIdol.com. Readers should do their research before investing in funds.
Price
News
Price
Price
Price

(0 comments)