Weekly Analysis: 5 Altcoins in a Slight Retracement

Some of the cryptocurrencies under consideration are falling and in a downward correction. For example, Klaytn and THORChain have fallen significantly to the downside. This has led to a downtrend that is erasing price gains.
THORChain
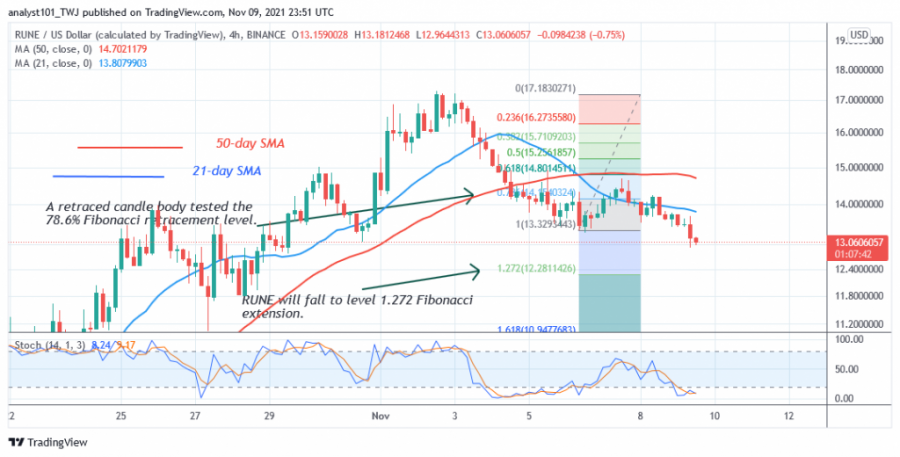
THORChain (RUNE) was previously in an uptrend, but was rejected at $17. The altcoin fell drastically to a low of $13, retested the high of $14 and continued its downward movement. The cryptocurrency has continued to fall after dropping below the moving averages.
The current selling pressure is likely to extend to the low of $12
Current Price: $13.06
Market Capitalization: $6,531,660,880
Trading Volume: $125,565,006
7-Day Loss %: 24.65%
Meanwhile, on November 6, the downtrend tested the 78.6% Fibonacci retracement level with a retreating candle. The retracement suggests that RUNE will fall to the Fibonacci extension level of 1.272 or $12.28.
SHIBA INU
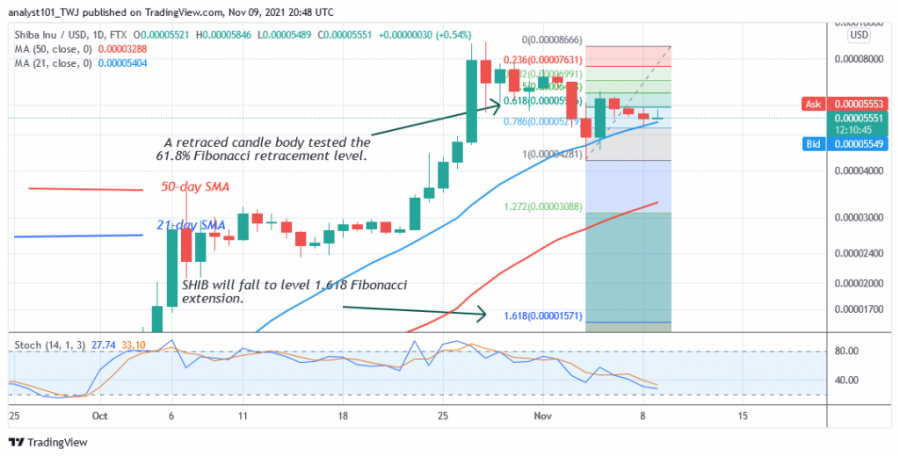
SHIBA INU (SHIB) has been in a downtrend since October 28. Today, SHIB has retraced from the high at $0.00008799 to the low at $0.00004277. There is a likelihood of further downside if the price falls below the moving averages. The altcoin is the second biggest loser of the past week.
Below are the cryptocurrency's characteristics:
Current Price: $0.00005526
Market Capitalization: $32.851.391.145
Trading Volume: $3,399,376,256
7-Day Loss %: 21.13%.
Meanwhile, the November 4 downtrend has a green candlestick testing the 61.8% Fibonacci retracement level. The retracement suggests that SHIB will fall to the 1.272 Fibonacci extension level or $0.00001571. If SHIB/USD holds above the moving averages, the bearish scenario will be invalidated by the price action.
Decentraland
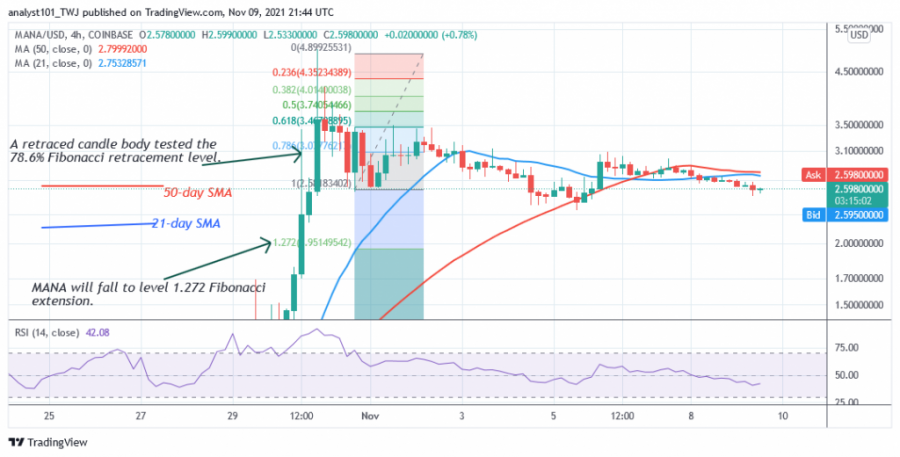
Decentraland's (MANA/USD) uptrend was terminated as bulls fail to keep MANA price above the $5 resistance zone. The cryptocurrency fell to the $2.55 support and continued to fluctuate below the $3.50 resistance level. Buyers tried to correct upwards but were rejected at the high of $3.50. The altcoin retreated and broke below the moving averages. This suggests that further downside is likely. MANA/USD is the third biggest loser of the past week.
These are some of its characteristics:
Current price: $2.60
Market capitalization: $5,639,915,735
Trading Volume: $938,992,813
7-Day Loss %: 16.43%
However, as the bears break below the moving averages, the altcoin could fall further. Meanwhile, on October 31, the downtrend; a retreating candlestick tested the 78.6% Fibonacci retracement level. The retracement suggests that MANA will fall but reverse at the 1.272 Fibonacci extension level or $1.95.
ICON
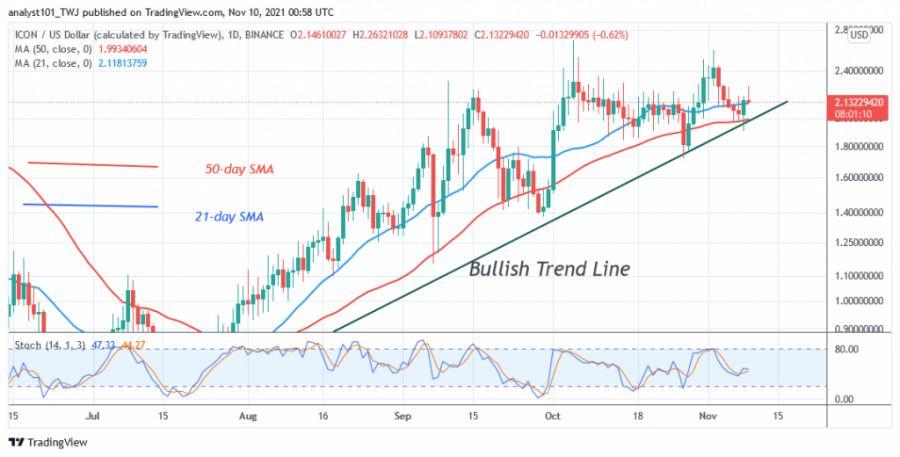
ICON (ICX) is in an uptrend but it stuck at the $2.40 resistance level. ICON will test the trend line and bounce to reach the resistance level. The uptrend will continue if the bulls break the high at $2.40. On the other hand, the downtrend will resume if the bears fall below the uptrend line. In the meantime, the cryptocurrency is in a range-bound move below the recent high. ICON (ICX) has the following characteristics.
Current Price: $2.14
Market Capitalization: $1,718,262,533
Trading Volume: $101,398,289
7-Day Loss %: 12.02%
Klaytn
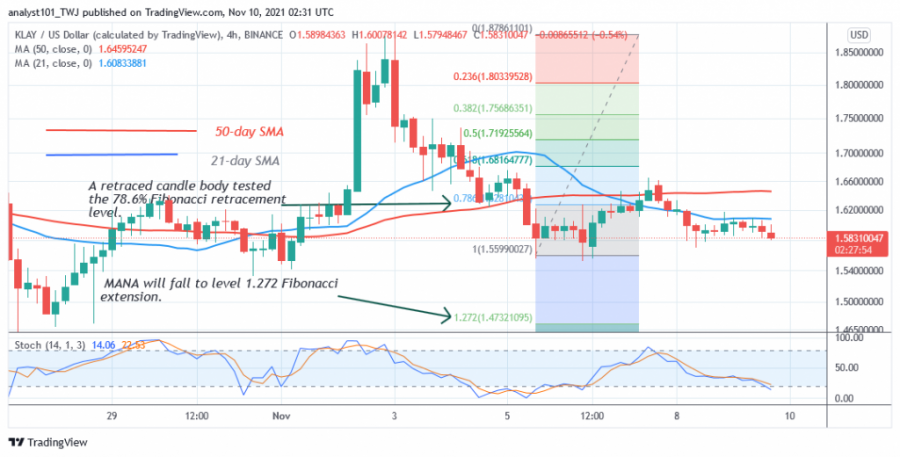
Klaytn (KLAY) was previously in an uptrend but was rejected at the high of $1.87. After the rejection, however, Klaytn resumed a downtrend. The downtrend has erased the upside gains from November. The altcoin's price has broken below the moving averages as the price continues to fall.
The cryptocurrency has the following characteristics:
Current Price: $1.58
Market Capitalization: $17,042,245,016
Trading Volume: : $110,721,581
7-Day Loss %: 11.30%
Meanwhile, on November 5, the downtrend tested the 78.6% Fibonacci retracement level with a declining candle. The retracement suggests that KLAY will fall but reverse at the 1.272 Fibonacci extension level or at $1.47.
News
Price
Coin expert
News
Coin expert

(0 comments)