TRON Shows Sideways Movement As Risks To Fall Below $0.102 Grow

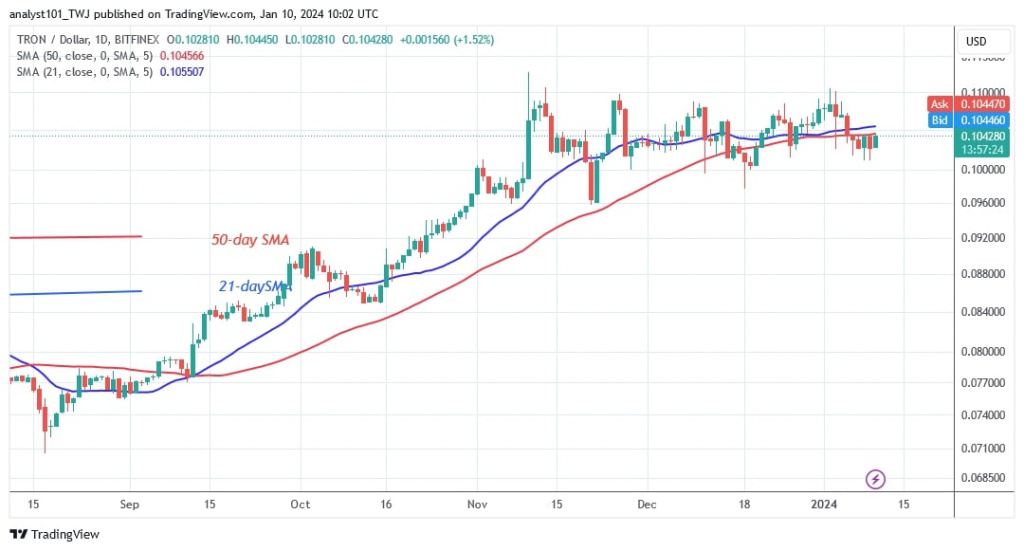
The price of TRON (TRX) has fallen below the moving average lines despite being in a sideways trend. TRON price analysis by Coinidol.com.
TRON price long term forecast: ranging
TRON has not been able to rise above the moving average lines since January 6. In the latest price action, the price of the cryptocurrency is set to rise above the moving average lines and retest the overhead barrier at $0.11. The cryptocurrency value has fallen below the moving average lines today, January 10, 2024.
The moving average lines have halted the uptrend since December 6. The altcoin is currently worth $0.104. TRON will fall if buyers are unable to sustain the positive trend above the moving average lines. The cryptocurrency will fall to the lows of $0.090 and $0.096.
TRON indicator reading
After a price decline on January 5, TRON's price bars are below the moving average lines. The altcoin will continue to fall if the negative momentum continues. Near the overhead resistance, the moving average lines have a slight horizontal slope. If the range lines are broken, the sideways trend will come to an end.
Technical indicators
Important supply zones: $0.09, $0.10, $0.11
Important demand zones: $0.06, $0.05, $0.04

What is the next direction for TRON?
TRON is in a sideways trend on the 4-hour chart, fluctuating in price between $0.102 and $0.11. Buyers have not been able to keep the price above the overhead resistance level since November 11. If the price falls below the current support level of $0.102, selling pressure will increase again.
Disclaimer. This analysis and forecast are the personal opinions of the author and are not a recommendation to buy or sell cryptocurrency and should not be viewed as an endorsement by CoinIdol.com. Readers should do the research before investing in funds.
Price
News
Price
Price
Price

(0 comments)