Toncoin Falls Below The Support Of $2.90 Again

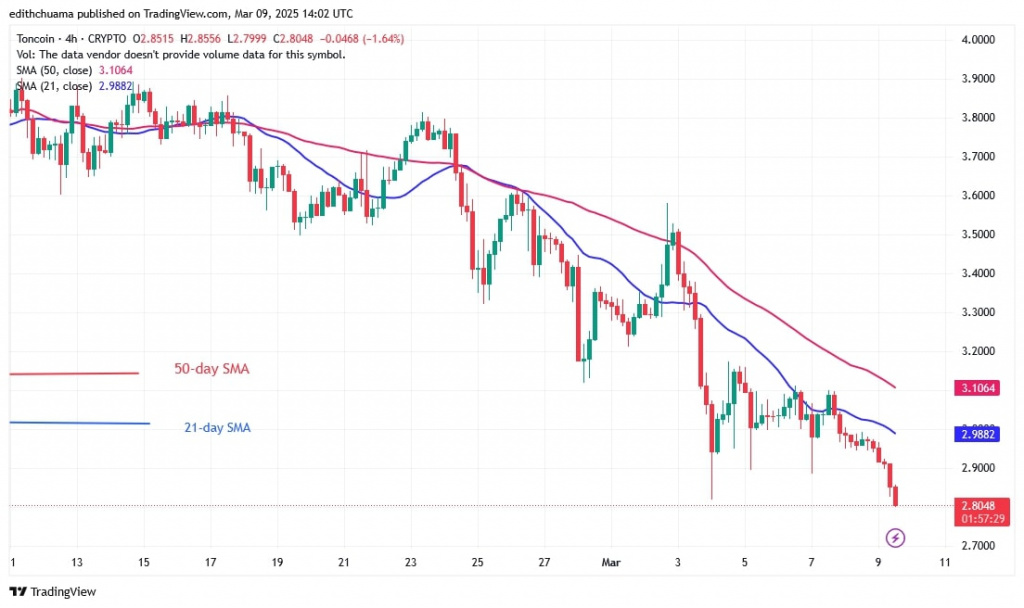
The price of Toncoin (TON), which has reached a low of $2.81, has been falling steadily. The cryptocurrency is approaching its low price of $2.00.
Long-term forecast for the TON price: bearish
However, the price indicator suggests that selling pressure will continue beyond the low price. On August 5, 2024, a bearish candlestick body on the weekly chart tested the 38.2% Fibonacci retracement level.
In view of the upward correction, TON is likely to continue its downward trend. The price indicator predicts that TON will fall to $0.483 or the 2.618 Fibonacci extension level.
Analysis of the TON indicator
The cryptocurrency has continued its downtrend as the price bars are below the moving average lines. The moving average lines on the 4-hour chart have a southerly slope. The bearish bias is evident on both charts as the 21-day SMA is below the 50-day SMA.
Technical Indicators
Resistance Levels: $6.00, $8.00, $10.00
Support Levels: $5.00, $3.00, $1.00

What is the next move for Toncoin?
TON has been bearish since falling below the current 4-hour chart support at $2.90. On the downside, the altcoin is approaching the lower $2.00 price level but will take a break above it if the $2.00 support is breached. Should this be the case, the price will fall to the previous low of $1.175.

Disclaimer. This analysis and forecast are the personal opinions of the author. They are not a recommendation to buy or sell cryptocurrency and should not be viewed as an endorsement by CoinIdol.com. Readers should do their research before investing in funds.
Price
Coin expert
Price
Price
Price

(0 comments)