Solana Recovers And Heads Towards Its Previous High Of $96

The price of Solana (SOL) falls below the moving average lines, but then rises again. Solana coin price analysis by Coinidol.com.
Long-term forecast for the Solana price: bearish
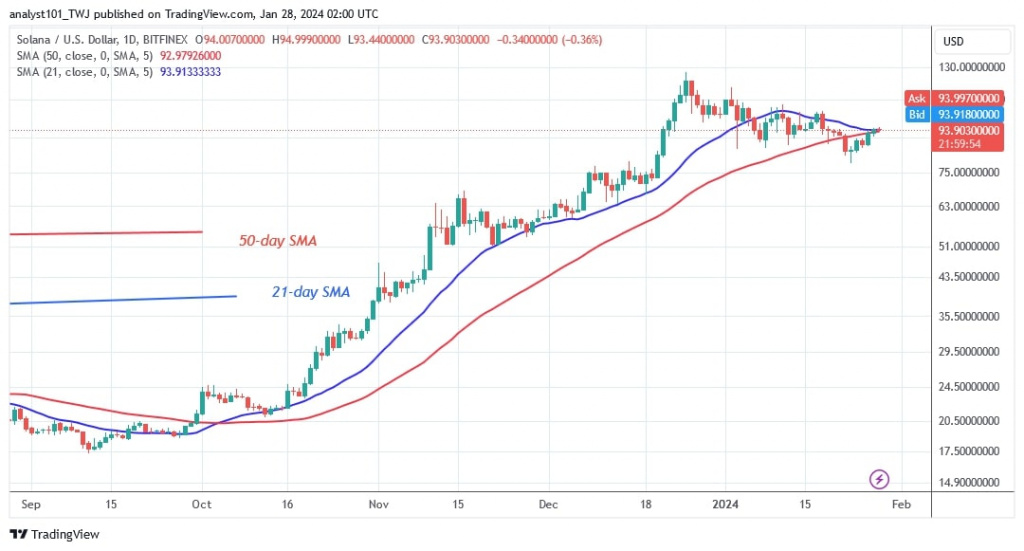
On January 23, Solana fell to a low of $78.99, but the bulls bought the dips. Buyers continue to drive the altcoin even though it remains between the moving average lines.
If the buyers keep the price above the moving averages, the positive trend will resume. The altcoin will rise and return to its previous highs of $110 and $120. Solana will fall if buyers are unable to sustain the bullish momentum above the moving averages. The altcoin will test the previous low of $82. SOL/USD remains trapped between the moving average lines.
Analysis of the Solana price indicator
On the daily chart, the price bars are between the moving average lines but appear to be above them, reports cryptocurrency analysis by Coinidol.com. The altcoin is expected to continue its uptrend. However, the price movement is being held back by the doji candlesticks.
Technical indicators
Key supply zones: $80, $90, $100
Key demand zones: $60, $50, $40

What is Solana's next move?
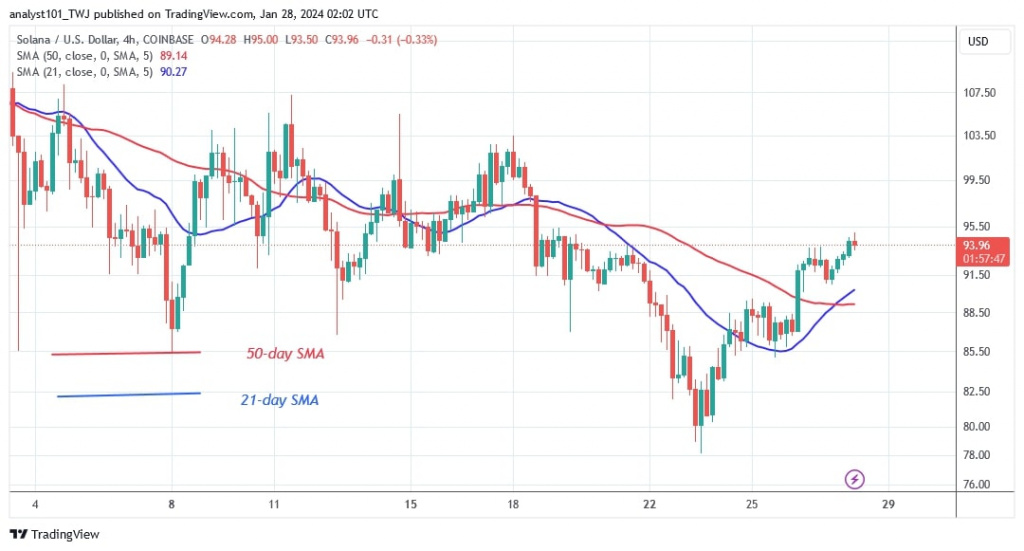
Solana is reaching bearish exhaustion as it remains above the $78 support. On the 4-hour chart, the altcoin rebounded as it broke above the moving averages. The bullish momentum is likely to reach a high of $96. However, the current rise will face resistance near the high of $102.

Disclaimer. This analysis and forecast are the personal opinions of the author and are not a recommendation to buy or sell cryptocurrency and should not be viewed as an endorsement by CoinIdol.com. Readers should do their research before investing in funds.
Price
News
Price
Price
Price

(0 comments)