Solana Oscillates Due To The Hurdle At $156

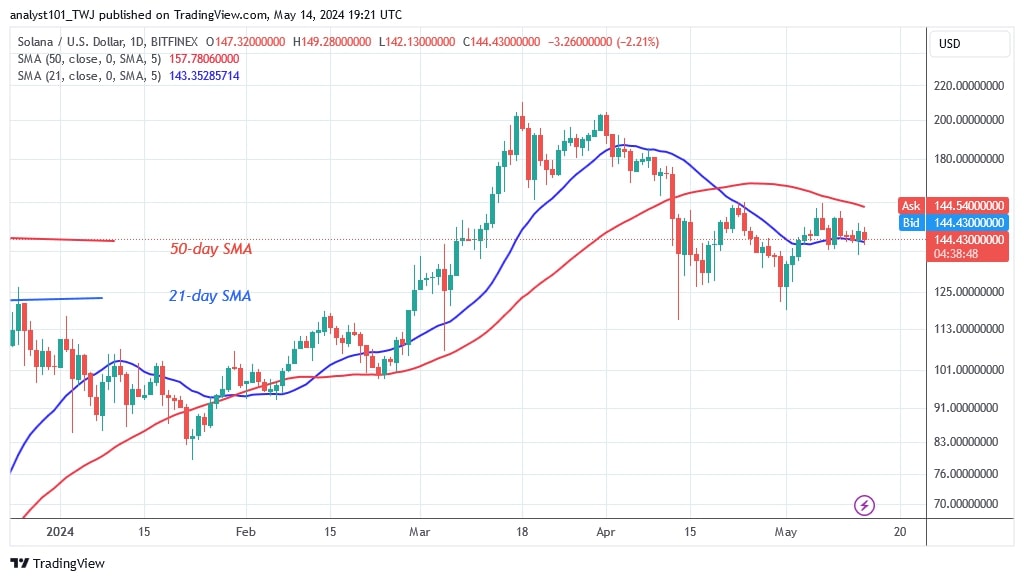
Solana (SOL) is currently trading above the $143 support level and the 21-day SMA as a result of the recent price rise.
Long-term forecast for the Solana price: bearish
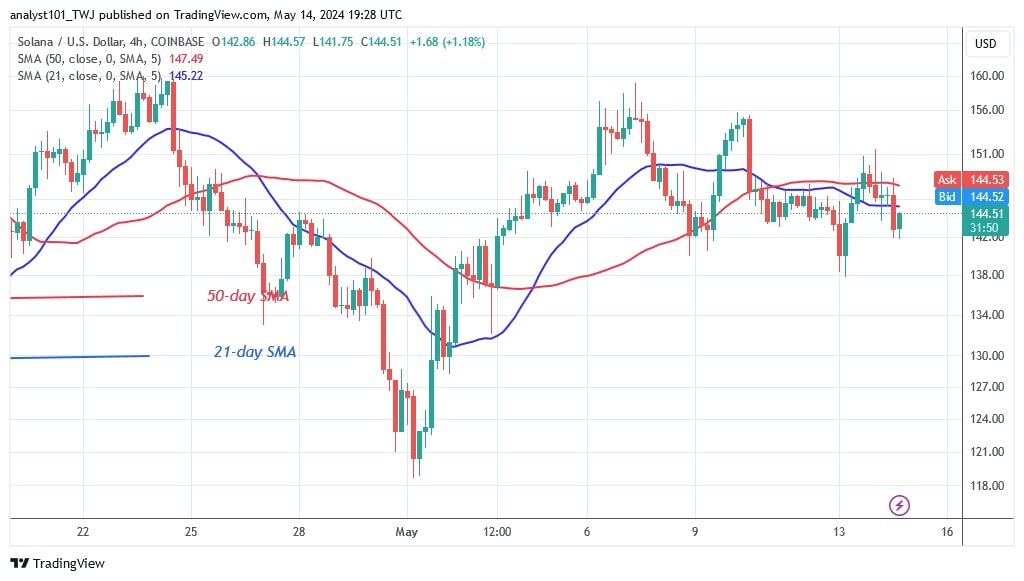
Since May 3, the altcoin has been trading above the 21-day SMA but below the 50-day SMA. The altcoin is unable to reach the high of the 50-day SMA due to the obstacle at $156. Solana is stuck between two moving average lines. The uptrend has been hindered as the bears are retesting the 21-day SMA support.
Should the bears break below the 21-day SMA support, Solana will come under renewed selling pressure. The altcoin will fall to its previous lows of $125 and $115. Solana is worth $142.80 at the time of writing.
Analysis of Solana price indicators
Since May 6, SOL price bars have been trapped between the moving average lines. Buyers have been unable to sustain the upside momentum above the 50-day SMA. This suggests that the crypto price will continue its fluctuation between the moving average lines.
Technical indicators
Important supply zones: $100, $120, $140
Important demand zones: $80, $60, $40

What is the next development for Solana?
Solana will remain above the support level of $143 due to the presence of doji candlesticks. However, if the altcoin rises above the current support, the positive momentum will break the resistance at $156 and the 50-day SMA barrier line. A rise to $210 is likely. However, if buyers fail to push the price higher, the current oscillation will continue.

Disclaimer. This analysis and forecast are the personal opinions of the author and are not a recommendation to buy or sell cryptocurrency and should not be viewed as an endorsement by CoinIdol.com. Readers should do their research before investing in funds.
Price
Price
News
Price
Price

(0 comments)