Solana Corrects Above $120, But Threatens To Fall Further

The price of Solana (SOL) has fallen to the bottom of the chart twice before rising again.
SOL price long-term forecast: bearish
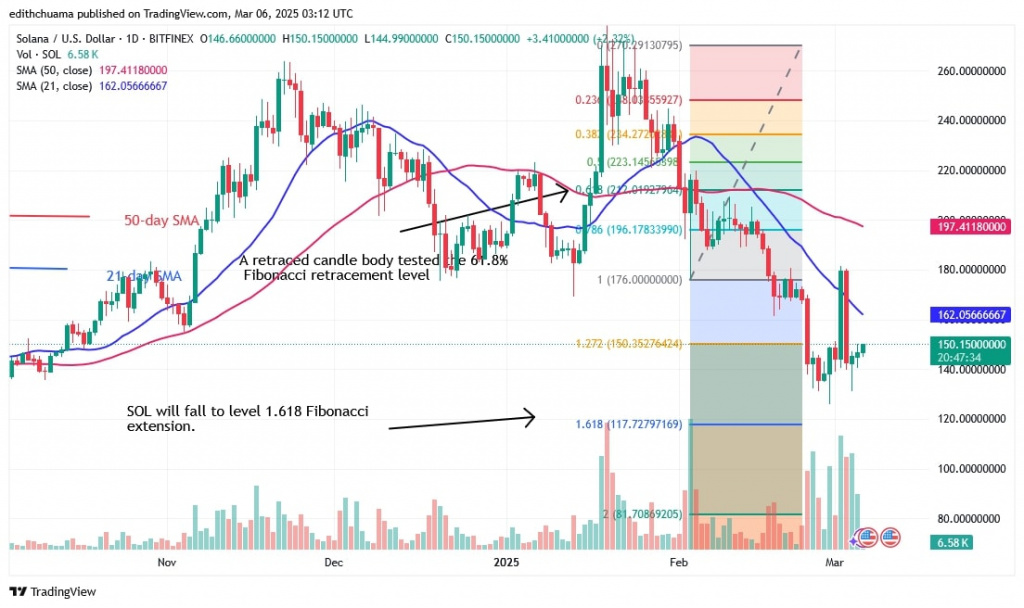
According to the price analysis by Coinidol.com, the cryptocurrency had fallen as low as $125 and $131 before correcting higher. The 21-day SMA has withstood the upward correction twice and the price indicator predicts a further decline to the Fibonacci extension level of $1.618 and $117.72 respectively.
Solana is trading below the moving average lines but above the $120 support. Selling pressure will return if the $120 support is broken. The altcoin is currently correcting upwards to retest the 21-day SMA. The uptrend will resume its upward movement if the 21-day SMA is broken and the upward momentum continues. The current price of Solana is $143.
Analysis of SOL price indicators
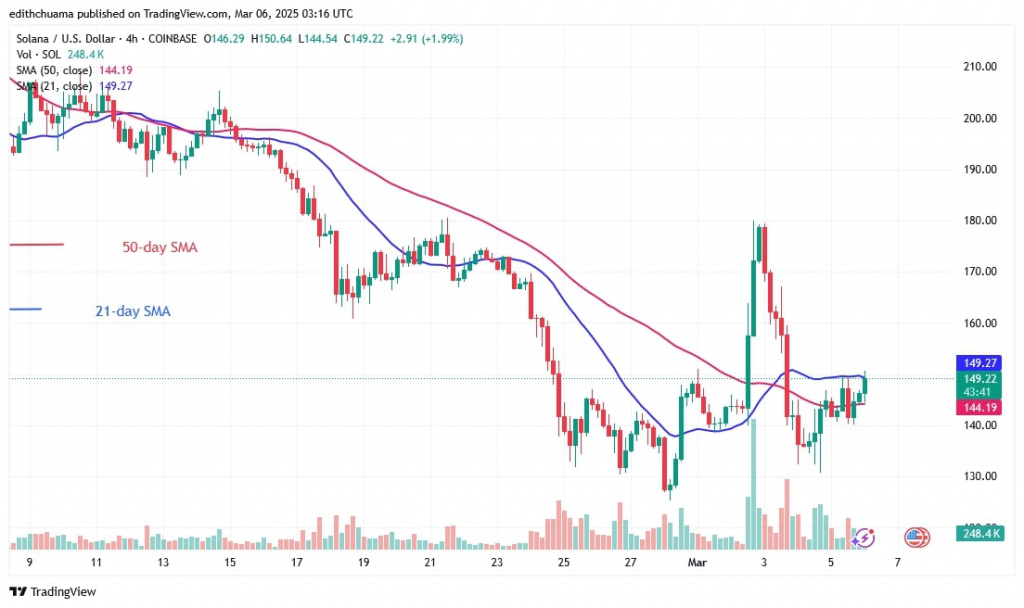
After the rejection of the 21-day SMA, the price bars are below the moving average lines. The downward trend of the horizontal moving average lines indicates a falling trend. The price bars on the 4-hour chart are trapped between the moving average lines. Solana will have to spend several days in this area.
Technical indicators
Key supply zones: $220, $240, $260
Key demand zones: $140, $120, $100

What's next for Solana?
Solana is correcting upwards after investors bought the dips above the $120 level. However, the appearance of doji candlesticks has slowed and limited the price movement. The altcoin will trade below the moving average lines and above the $120 support until the trend is established.

Disclaimer. This analysis and forecast are the personal opinions of the author. They are not a recommendation to buy or sell cryptocurrency and should not be viewed as an endorsement by CoinIdol.com. Readers should do their research before investing in funds.
Price
Coin expert
Price
News
Coin expert

(0 comments)