Solana Reaches A High Of $160 And Begins Its Upward Trend

The price of Solana (SOL) bounces and moves positively above the 21-day moving averages.
Solana price long term forecast: bearish
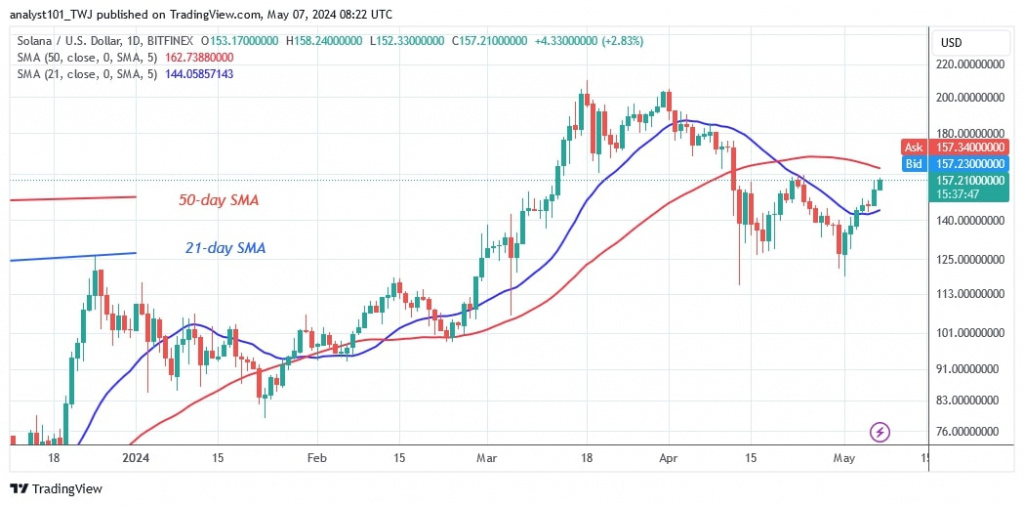
The cryptocurrency is above the 21-day SMA but below the 50-day SMA. The bullish momentum continues and is approaching the 50-day SMA or resistance at $163.
If the price of the cryptocurrency rises above the 50-day SMA or resistance at $163, Solana will rally to the previous highs of $200 and $210. Conversely, Solana will be trapped between the moving average lines where it will be rejected at the 50-day SMA or resistance at $163. Solana will fluctuate between $140 and $160 until the trend emerges. SOL/USD is at $158 at the time of writing.
Analysis of the Solana price indicator
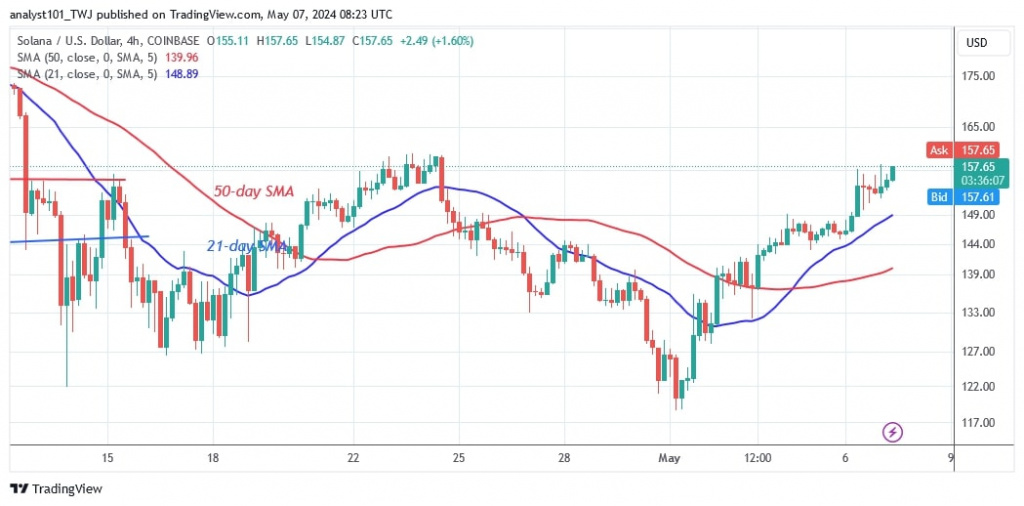
Solana has resumed its uptrend as the price bars on the 4-hour chart remain above the moving average lines. The uptrend will face resistance as the price bars are caught between the moving average lines. Meanwhile, the moving average lines are sloping upwards, indicating an uptrend.
Technical Indicators
Important supply zones: $100, $120, $140
Important demand zones: $80, $60, $40

What is the next move for Solana?
Solana is in an uptrend as the price of the cryptocurrency bounces above the 21-day SMA. The altcoin is rising and approaching the previous high of $160, which was the previous resistance. The uptrend will continue if the altcoin breaks through the resistance at $160. On the other hand, the cryptocurrency will initiate a sideways movement if the recent high is broken.

Disclaimer. This analysis and forecast are the personal opinions of the author and are not a recommendation to buy or sell cryptocurrency and should not be viewed as an endorsement by CoinIdol.com. Readers should do their research before investing in funds.
Price
Price
News
Price
Price

(0 comments)