Ripple Revisits Crucial Support at $0.51 as XRP Looks Oversold

The price of Ripple (XRP) is falling as it approaches its previous low at $0.51. Today, XRP is trading at $0.53 at the time of writing. The market will reach the oversold region if the selling pressure continues.
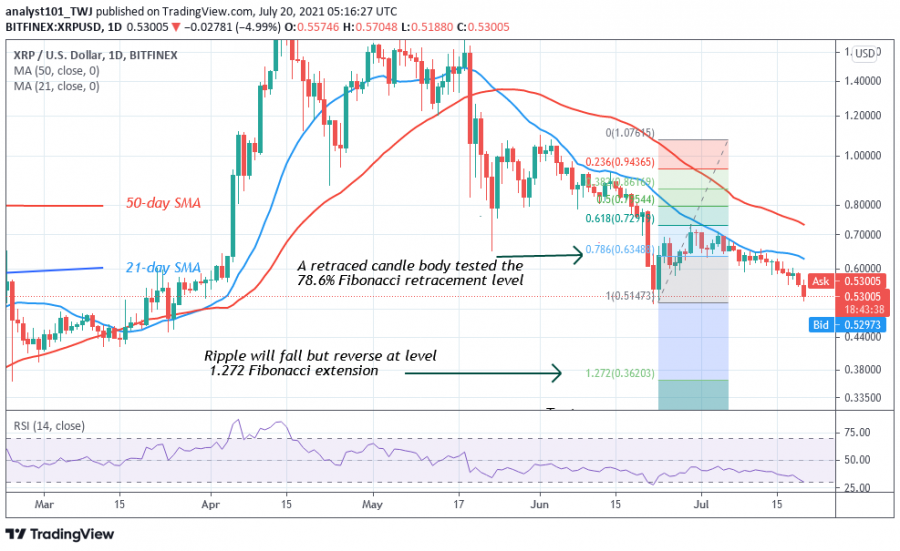
Nonetheless, the bears have not broken below the $0.51 support since April. However, if the bears break the $0.51 support, XRP/USD will drop low to either $0.41 or $0.36. On the other hand, if the $0.51 support holds, Ripple is likely to resume the upside above the previous low. Meanwhile, on June 22 downtrend, a retraced candle body tested the 78.6% Fibonacci retracement level. The retracement indicates that Ripple is likely to fall but reverse at the 1.272 Fibonacci extension level or $0.36 level.
Ripple indicator analysis
XRP has fallen to the level 30 of the Relative Strength Index of the period 14. It indicates that the market has reached the oversold region. The current selling pressure is likely to ease. The 21-day and 50-day SMAs are sloping downward, indicating the downtrend. Ripple is below the 20% area of the daily stochastic. According to the price indicator, XRP is trading in the oversold zone of the market.

Technical indicators:
Major Resistance Levels - $1.95 and $2.0
Major Support Levels - $0.80 and $0.60
What is the next move for Ripple?
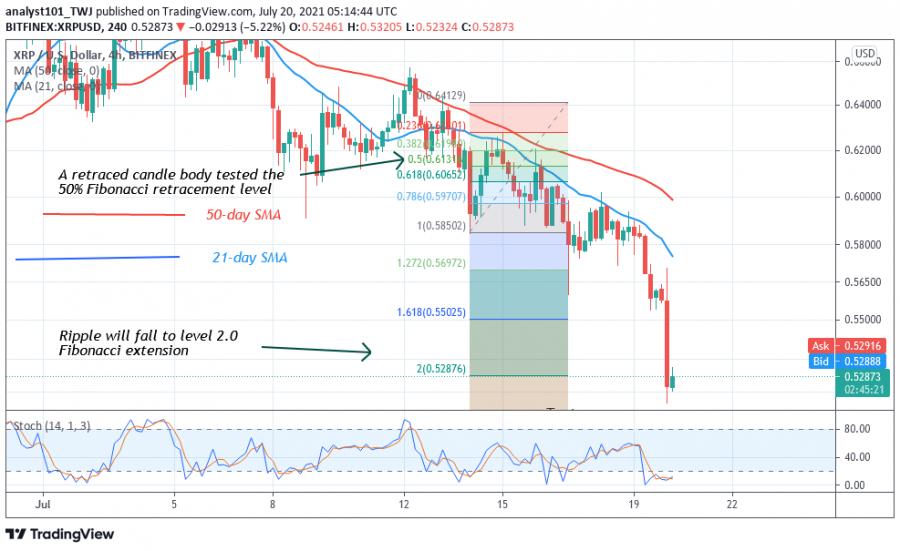
Ripple fell sharply to $0.51 support as the bears broke through $0.59 support. Price pulled back above $0.51 support, which has yet to be breached in the last three months. Meanwhile, on July 14 downtrend, a retraced candle body tested the 50% Fibonacci retracement level. The retracement suggests that Ripple is likely to fall to the 2.0 Fibonacci Extension level or the $0.52 level. From the price action, XRP has retested the 2.0 Fibonacci extension but has not indicated further downside.

Disclaimer. This analysis and forecast are the personal opinions of the author are not a recommendation to buy or sell cryptocurrency and should not be viewed as an endorsement by CoinIdol. Readers should do their own research before investing.
Price
Price
Price
Price
Price

(0 comments)