Ripple Unable to Clear the Hurdle at $0.248 High, Resumes Sideways Move

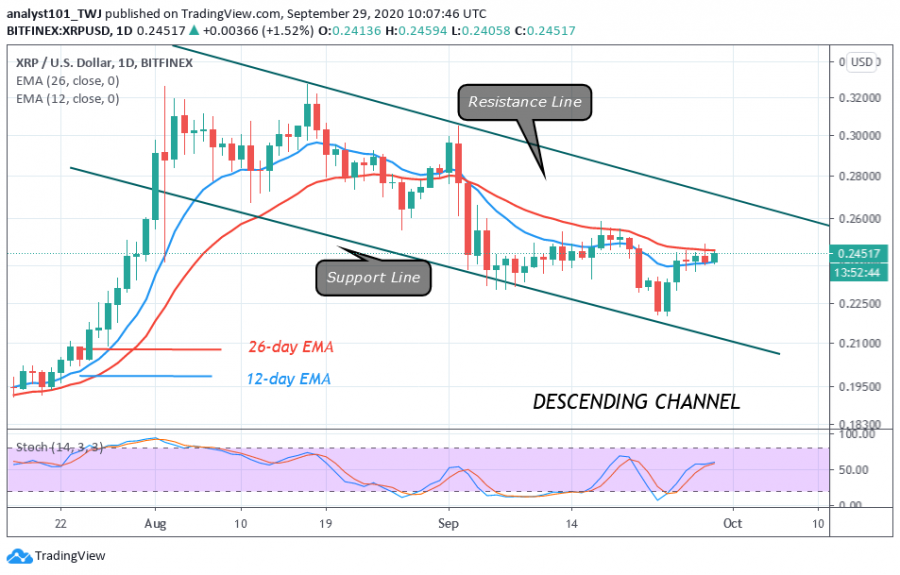
Ripple has been on a sideways move above $0.24 support after recovering from the earlier downtrend. The sideways move becomes necessary because buyers fail to break into the previous highs.
Sellers are providing stiff resistance at the $0.248 high since September 26. XRP has been compelled to fluctuate between $0.24 and $0.248. On the upside, the major impediment to price rise is the resistance at $0.248.
If buyers clear the current resistance, XRP will rise above $0.26 high. At the $0.26 support, Ripple will have an accelerated price movement. The bullish momentum is likely to reach a high of $0.30. However, the upward move will not be an easy walk for the buyers. Except in a few cases, the coin will face minor resistance on the upside. Ripple will fall if the bears break the $0.24 support. The market will drop sharply to $0.23 and subsequently, reach the $0.21 low.
Ripple indicator analysis
The coin is in the bearish trend zone. The price has broken above the 12-day EMA but yet to break the 26-day EMA. Ripple is above the 50% range of the daily stochastic. This indicates that the coin has bullish momentum. On the downside, XRP will fall if it fails to break above the 26-day EMA.

Key Resistance Zones: $0.35, $0.40, $0.45
Key Support Zones: $0.25, $0.20, $0.15
What is the next move for Ripple?
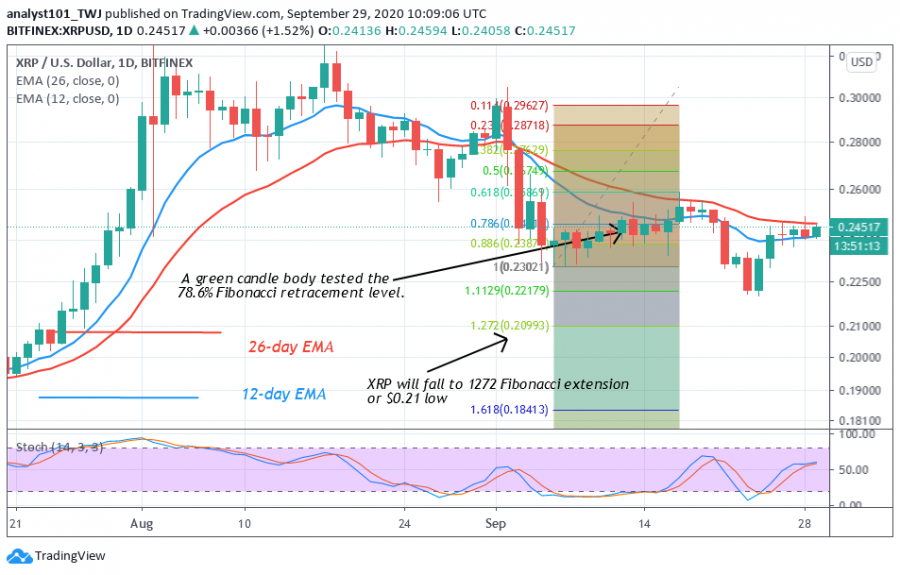
The next move of Ripple will be determined on the current range-bound movement between $0.24 and $0.248. There may be a change in the trend if price breaks above $0.248 resistance. The upside momentum will resume. On the other hand, if the lower price range is broken. XRP will fall and the Fibonacci tool analysis may hold. That is, the decline will reach the low of 1.272 Fibonacci extension or the low of $0.21.

Disclaimer. This analysis and forecast are the personal opinions of the author that are not a recommendation to buy or sell cryptocurrency and should not be viewed as an endorsement by CoinIdol. Readers should do their own research before investing funds.
Coin expert
Price
Price
Price
Coin expert

(0 comments)