Ripple Reaches Bearish Exhaustion at $0.237 Low, Uptrending Likely

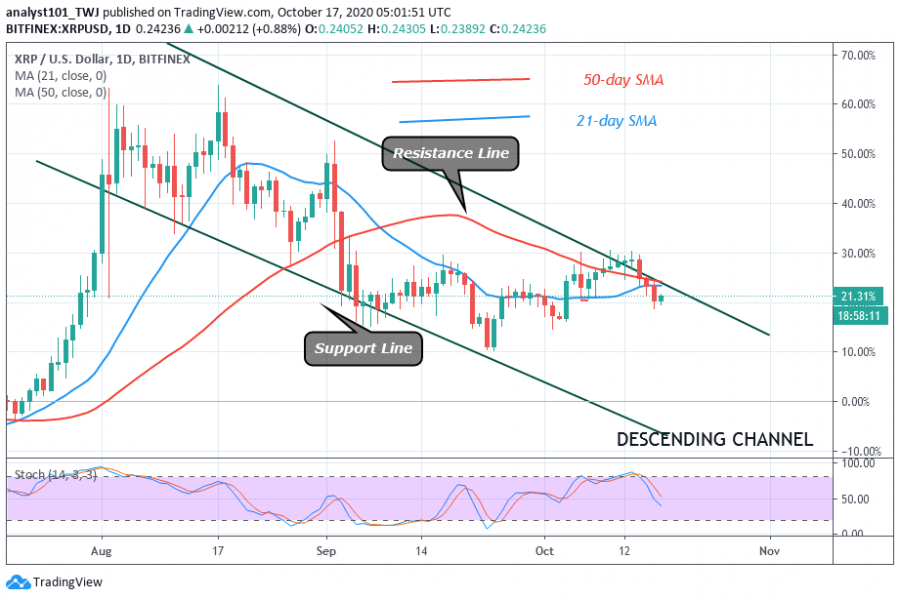
The rejection at the $0.26 overhead resistance has reached a low of $0.24 as the price falls into the bearish trend zone. Today, the crypto’s price is fluctuating above $0.24.
There is a possibility of Ripple recovering and resuming the upside momentum. Perhaps, if there is a strong bounce above the $0.24 support, XRP will rise and the price momentum will rally above the $0.26 resistance. On the other hand, if the current breakdown extends and falls below $0.24, the price will continue to fall to the previous lows.
Nonetheless, if the breakdown extends below the moving averages, the coin is likely to be range-bound in the bearish trend zone for a few more days. In the meantime, the coin is trading at $0.2405 at the time of writing. The price action is showing a bearish signal of a further downward movement of the coin.
Ripple indicator analysis
XRP is below the 50 % range of the daily stochastic. The coin is now in a bearish momentum. It has earlier been in the overbought condition since October 6. The price bars are now below the SMAs which suggests a further downward movement of the coin.

Key Resistance Zones: $0.35, $0.40, $0.45
Key Support Zones: $0.25, $0.20, $0.15
What is the next move for Ripple?
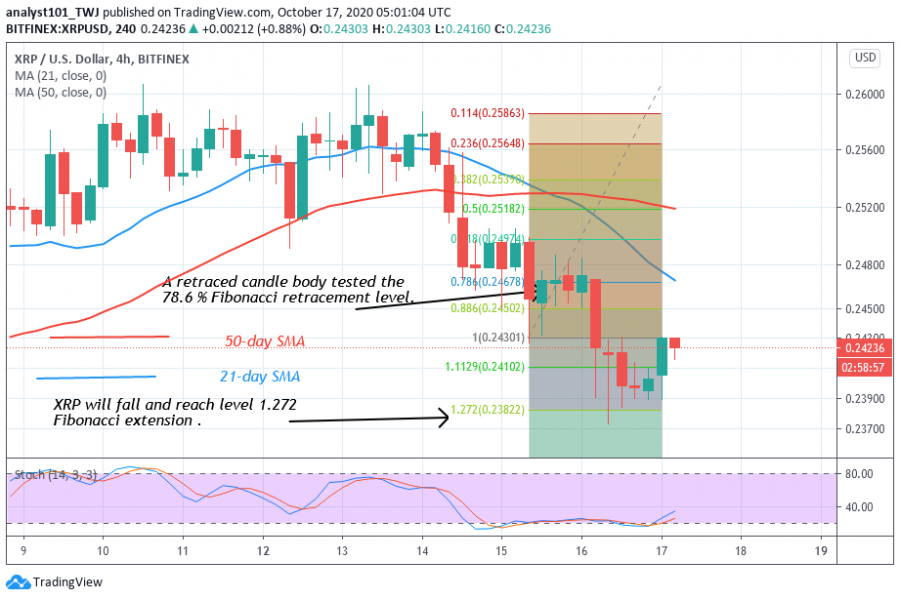
From the price action, there is a possibility of a further downward movement of the coin. On October 15 downtrend, the retraced candlestick tested the 78.6% Fibonacci retracement level. This retracement indicates that XRP will fall to 1.272 Fibonacci extension. In other words, Ripple will reach a low of $0.238 and reverse. The coin will first reverse to 78.6% Fibonacci retracement where it originated.

Disclaimer. This analysis and forecast are the personal opinions of the author that are not a recommendation to buy or sell cryptocurrency and should not be viewed as an endorsement by CoinIdol. Readers should do their own research before investing funds.
Price
Price
Price
Price
News

(0 comments)